Bangladeshi vs Pueblo Child Poverty Among Boys Under 16
COMPARE
Bangladeshi
Pueblo
Child Poverty Among Boys Under 16
Child Poverty Among Boys Under 16 Comparison
Bangladeshis
Pueblo
20.0%
CHILD POVERTY AMONG BOYS UNDER 16
0.0/ 100
METRIC RATING
279th/ 347
METRIC RANK
23.5%
CHILD POVERTY AMONG BOYS UNDER 16
0.0/ 100
METRIC RATING
328th/ 347
METRIC RANK
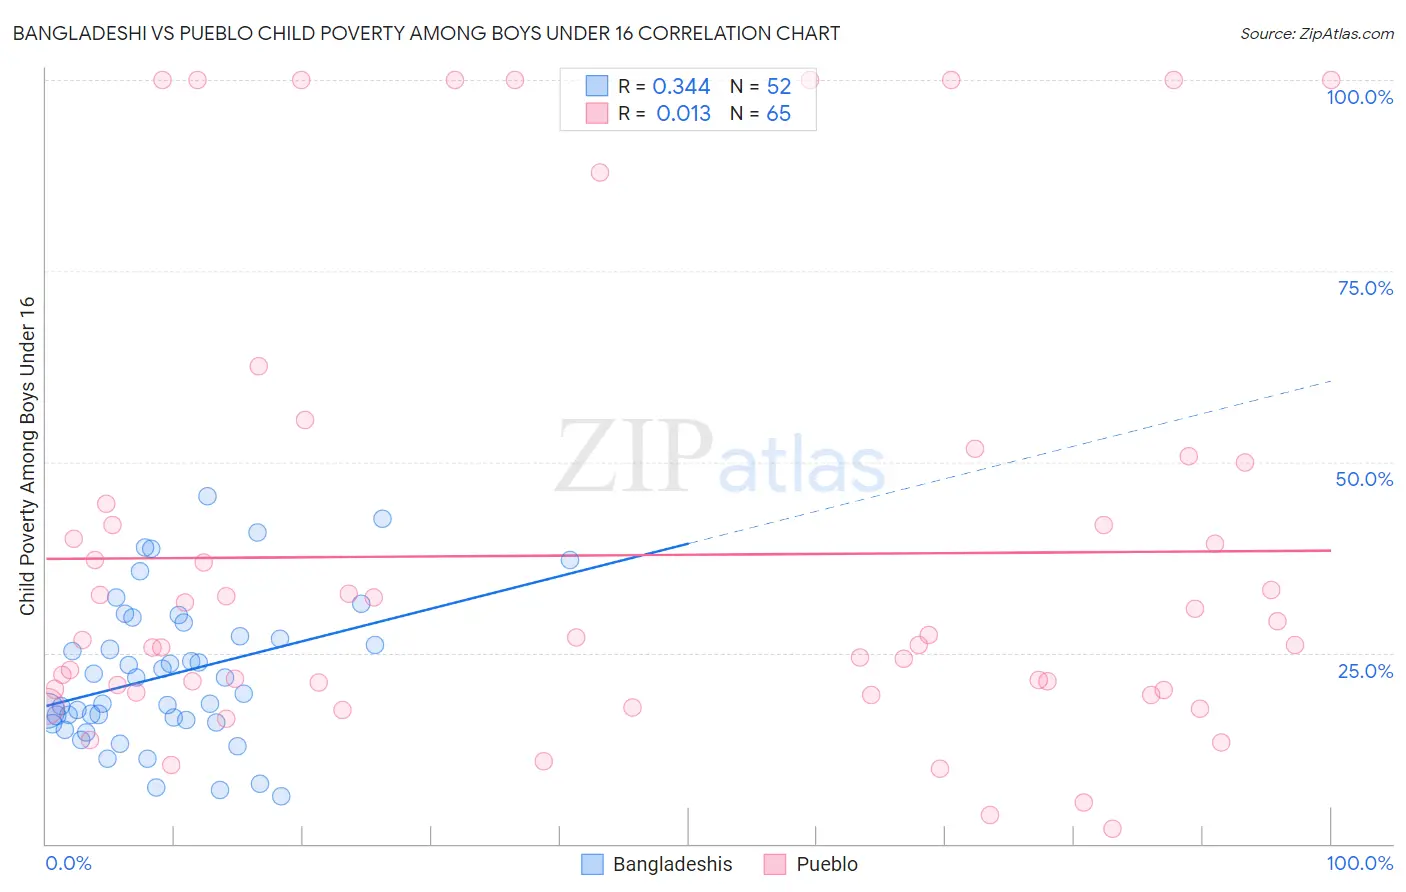
Bangladeshi vs Pueblo Child Poverty Among Boys Under 16 Correlation Chart
The statistical analysis conducted on geographies consisting of 140,641,958 people shows a mild positive correlation between the proportion of Bangladeshis and poverty level among boys under the age of 16 in the United States with a correlation coefficient (R) of 0.344 and weighted average of 20.0%. Similarly, the statistical analysis conducted on geographies consisting of 119,570,192 people shows no correlation between the proportion of Pueblo and poverty level among boys under the age of 16 in the United States with a correlation coefficient (R) of 0.013 and weighted average of 23.5%, a difference of 17.4%.
Child Poverty Among Boys Under 16 Correlation Summary
| Measurement | Bangladeshi | Pueblo |
| Minimum | 6.2% | 2.0% |
| Maximum | 45.5% | 100.0% |
| Range | 39.2% | 98.0% |
| Mean | 22.2% | 37.8% |
| Median | 20.7% | 26.7% |
| Interquartile 25% (IQ1) | 16.0% | 20.0% |
| Interquartile 75% (IQ3) | 28.1% | 43.2% |
| Interquartile Range (IQR) | 12.1% | 23.2% |
| Standard Deviation (Sample) | 9.5% | 28.8% |
| Standard Deviation (Population) | 9.5% | 28.6% |
Similar Demographics by Child Poverty Among Boys Under 16
Demographics Similar to Bangladeshis by Child Poverty Among Boys Under 16
In terms of child poverty among boys under 16, the demographic groups most similar to Bangladeshis are Central American (20.1%, a difference of 0.12%), Immigrants from West Indies (20.0%, a difference of 0.13%), Immigrants from Barbados (20.0%, a difference of 0.15%), Immigrants from Zaire (20.1%, a difference of 0.18%), and Comanche (20.1%, a difference of 0.23%).
| Demographics | Rating | Rank | Child Poverty Among Boys Under 16 |
| Immigrants | Ecuador | 0.1 /100 | #272 | Tragic 19.8% |
| Belizeans | 0.1 /100 | #273 | Tragic 19.9% |
| Immigrants | Bangladesh | 0.0 /100 | #274 | Tragic 19.9% |
| Jamaicans | 0.0 /100 | #275 | Tragic 20.0% |
| Sub-Saharan Africans | 0.0 /100 | #276 | Tragic 20.0% |
| Immigrants | Barbados | 0.0 /100 | #277 | Tragic 20.0% |
| Immigrants | West Indies | 0.0 /100 | #278 | Tragic 20.0% |
| Bangladeshis | 0.0 /100 | #279 | Tragic 20.0% |
| Central Americans | 0.0 /100 | #280 | Tragic 20.1% |
| Immigrants | Zaire | 0.0 /100 | #281 | Tragic 20.1% |
| Comanche | 0.0 /100 | #282 | Tragic 20.1% |
| Immigrants | Jamaica | 0.0 /100 | #283 | Tragic 20.1% |
| Barbadians | 0.0 /100 | #284 | Tragic 20.2% |
| Arapaho | 0.0 /100 | #285 | Tragic 20.2% |
| West Indians | 0.0 /100 | #286 | Tragic 20.3% |
Demographics Similar to Pueblo by Child Poverty Among Boys Under 16
In terms of child poverty among boys under 16, the demographic groups most similar to Pueblo are Native/Alaskan (24.0%, a difference of 1.9%), Colville (24.1%, a difference of 2.5%), Dominican (24.2%, a difference of 2.8%), Immigrants from Honduras (22.8%, a difference of 3.2%), and Paiute (22.8%, a difference of 3.3%).
| Demographics | Rating | Rank | Child Poverty Among Boys Under 16 |
| Cajuns | 0.0 /100 | #321 | Tragic 22.2% |
| Immigrants | Dominica | 0.0 /100 | #322 | Tragic 22.2% |
| Hondurans | 0.0 /100 | #323 | Tragic 22.3% |
| Immigrants | Congo | 0.0 /100 | #324 | Tragic 22.4% |
| Central American Indians | 0.0 /100 | #325 | Tragic 22.5% |
| Paiute | 0.0 /100 | #326 | Tragic 22.8% |
| Immigrants | Honduras | 0.0 /100 | #327 | Tragic 22.8% |
| Pueblo | 0.0 /100 | #328 | Tragic 23.5% |
| Natives/Alaskans | 0.0 /100 | #329 | Tragic 24.0% |
| Colville | 0.0 /100 | #330 | Tragic 24.1% |
| Dominicans | 0.0 /100 | #331 | Tragic 24.2% |
| Immigrants | Dominican Republic | 0.0 /100 | #332 | Tragic 24.3% |
| Apache | 0.0 /100 | #333 | Tragic 24.5% |
| Blacks/African Americans | 0.0 /100 | #334 | Tragic 24.5% |
| Yup'ik | 0.0 /100 | #335 | Tragic 24.7% |