Bangladeshi vs Slovene Child Poverty Under the Age of 5
COMPARE
Bangladeshi
Slovene
Child Poverty Under the Age of 5
Child Poverty Under the Age of 5 Comparison
Bangladeshis
Slovenes
20.6%
CHILD POVERTY UNDER THE AGE OF 5
0.1/ 100
METRIC RATING
275th/ 347
METRIC RANK
16.0%
CHILD POVERTY UNDER THE AGE OF 5
94.4/ 100
METRIC RATING
107th/ 347
METRIC RANK
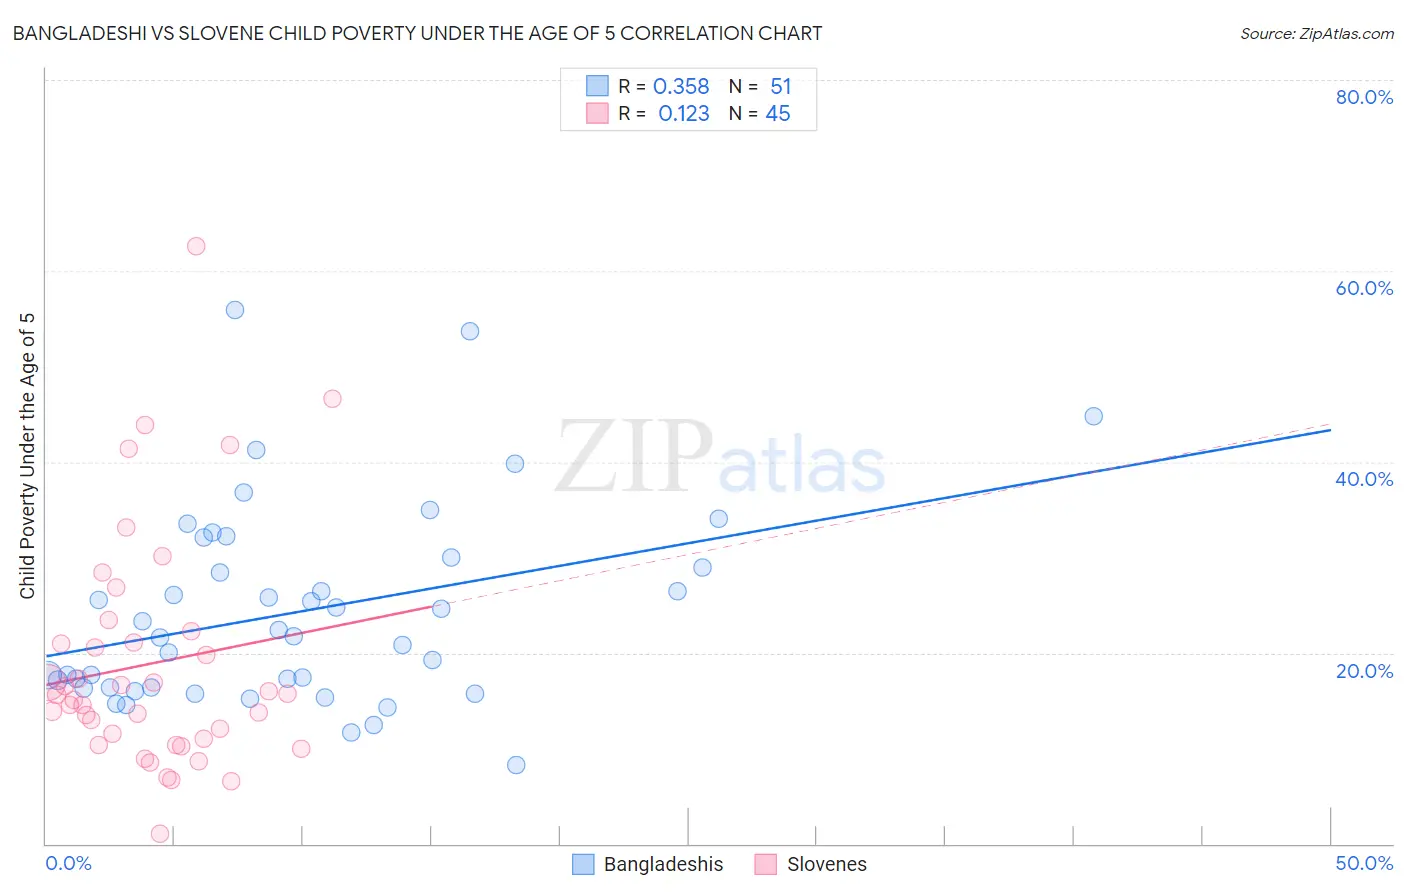
Bangladeshi vs Slovene Child Poverty Under the Age of 5 Correlation Chart
The statistical analysis conducted on geographies consisting of 139,356,548 people shows a mild positive correlation between the proportion of Bangladeshis and poverty level among children under the age of 5 in the United States with a correlation coefficient (R) of 0.358 and weighted average of 20.6%. Similarly, the statistical analysis conducted on geographies consisting of 251,690,205 people shows a poor positive correlation between the proportion of Slovenes and poverty level among children under the age of 5 in the United States with a correlation coefficient (R) of 0.123 and weighted average of 16.0%, a difference of 29.2%.
Child Poverty Under the Age of 5 Correlation Summary
| Measurement | Bangladeshi | Slovene |
| Minimum | 8.3% | 1.0% |
| Maximum | 55.9% | 62.6% |
| Range | 47.5% | 61.6% |
| Mean | 24.3% | 18.9% |
| Median | 21.7% | 15.6% |
| Interquartile 25% (IQ1) | 16.4% | 10.7% |
| Interquartile 75% (IQ3) | 30.0% | 21.7% |
| Interquartile Range (IQR) | 13.6% | 11.0% |
| Standard Deviation (Sample) | 10.3% | 12.3% |
| Standard Deviation (Population) | 10.2% | 12.2% |
Similar Demographics by Child Poverty Under the Age of 5
Demographics Similar to Bangladeshis by Child Poverty Under the Age of 5
In terms of child poverty under the age of 5, the demographic groups most similar to Bangladeshis are Immigrants from Belize (20.6%, a difference of 0.050%), West Indian (20.6%, a difference of 0.090%), Central American (20.6%, a difference of 0.15%), Immigrants from West Indies (20.7%, a difference of 0.26%), and Immigrants from Grenada (20.7%, a difference of 0.28%).
| Demographics | Rating | Rank | Child Poverty Under the Age of 5 |
| Belizeans | 0.1 /100 | #268 | Tragic 20.3% |
| Immigrants | Burma/Myanmar | 0.1 /100 | #269 | Tragic 20.4% |
| Jamaicans | 0.1 /100 | #270 | Tragic 20.4% |
| Americans | 0.1 /100 | #271 | Tragic 20.5% |
| Immigrants | Jamaica | 0.1 /100 | #272 | Tragic 20.5% |
| Central Americans | 0.1 /100 | #273 | Tragic 20.6% |
| Immigrants | Belize | 0.1 /100 | #274 | Tragic 20.6% |
| Bangladeshis | 0.1 /100 | #275 | Tragic 20.6% |
| West Indians | 0.0 /100 | #276 | Tragic 20.6% |
| Immigrants | West Indies | 0.0 /100 | #277 | Tragic 20.7% |
| Immigrants | Grenada | 0.0 /100 | #278 | Tragic 20.7% |
| Sub-Saharan Africans | 0.0 /100 | #279 | Tragic 20.8% |
| French American Indians | 0.0 /100 | #280 | Tragic 20.8% |
| Senegalese | 0.0 /100 | #281 | Tragic 20.9% |
| Potawatomi | 0.0 /100 | #282 | Tragic 21.0% |
Demographics Similar to Slovenes by Child Poverty Under the Age of 5
In terms of child poverty under the age of 5, the demographic groups most similar to Slovenes are Immigrants from Brazil (16.0%, a difference of 0.010%), Northern European (16.0%, a difference of 0.090%), Romanian (16.0%, a difference of 0.10%), Tlingit-Haida (15.9%, a difference of 0.14%), and Pakistani (16.0%, a difference of 0.14%).
| Demographics | Rating | Rank | Child Poverty Under the Age of 5 |
| Immigrants | Canada | 95.9 /100 | #100 | Exceptional 15.8% |
| Immigrants | Zimbabwe | 95.9 /100 | #101 | Exceptional 15.8% |
| Armenians | 95.7 /100 | #102 | Exceptional 15.8% |
| Europeans | 95.3 /100 | #103 | Exceptional 15.9% |
| Immigrants | North America | 94.9 /100 | #104 | Exceptional 15.9% |
| Immigrants | Spain | 94.8 /100 | #105 | Exceptional 15.9% |
| Tlingit-Haida | 94.7 /100 | #106 | Exceptional 15.9% |
| Slovenes | 94.4 /100 | #107 | Exceptional 16.0% |
| Immigrants | Brazil | 94.4 /100 | #108 | Exceptional 16.0% |
| Northern Europeans | 94.3 /100 | #109 | Exceptional 16.0% |
| Romanians | 94.3 /100 | #110 | Exceptional 16.0% |
| Pakistanis | 94.2 /100 | #111 | Exceptional 16.0% |
| Peruvians | 94.1 /100 | #112 | Exceptional 16.0% |
| Puget Sound Salish | 94.1 /100 | #113 | Exceptional 16.0% |
| Immigrants | Kuwait | 93.9 /100 | #114 | Exceptional 16.0% |