Bangladeshi vs Slovene Bachelor's Degree
COMPARE
Bangladeshi
Slovene
Bachelor's Degree
Bachelor's Degree Comparison
Bangladeshis
Slovenes
30.2%
BACHELOR'S DEGREE
0.0/ 100
METRIC RATING
303rd/ 347
METRIC RANK
39.1%
BACHELOR'S DEGREE
79.5/ 100
METRIC RATING
145th/ 347
METRIC RANK
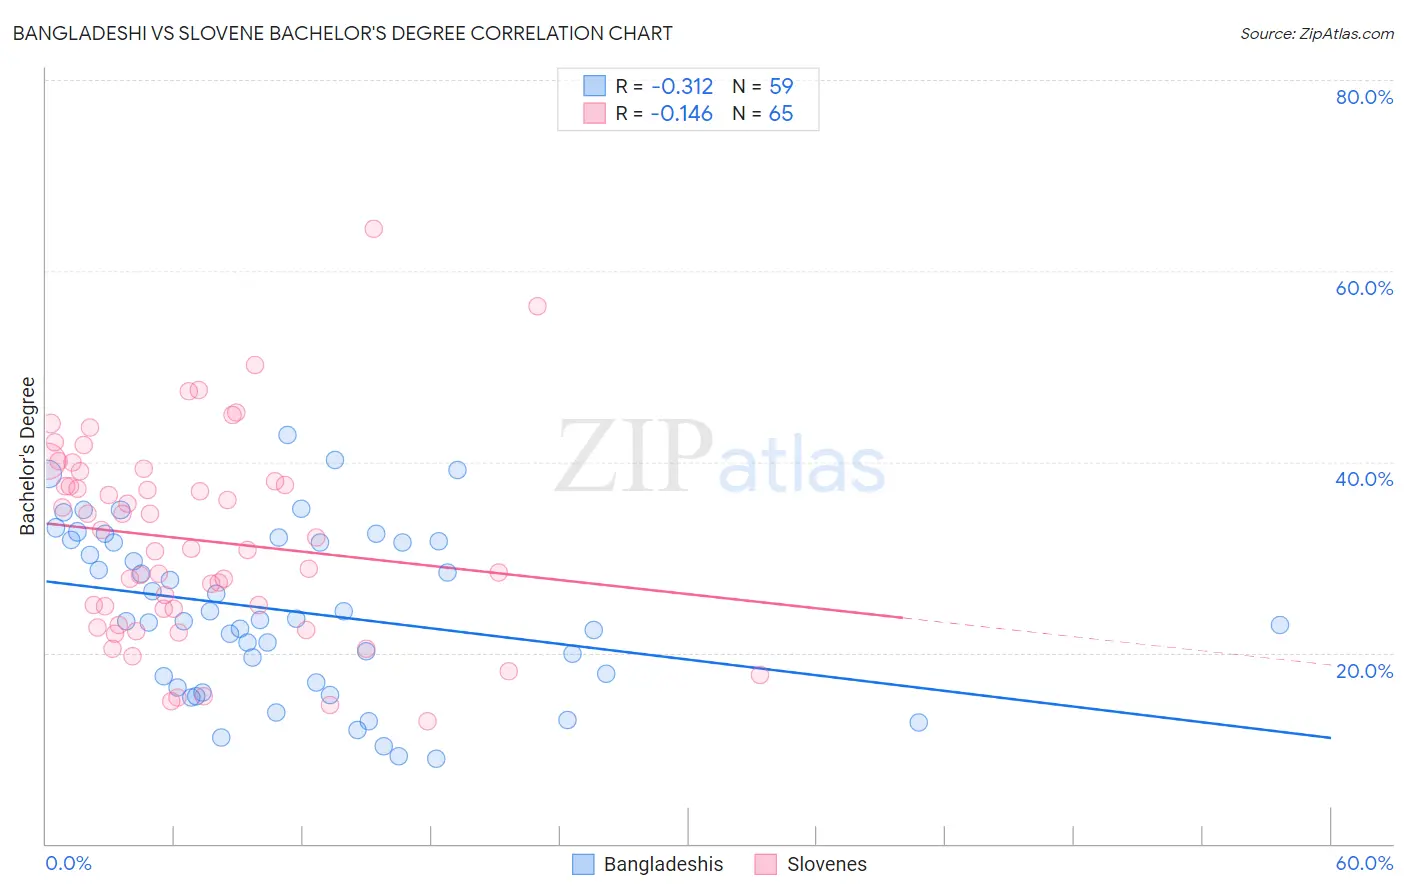
Bangladeshi vs Slovene Bachelor's Degree Correlation Chart
The statistical analysis conducted on geographies consisting of 141,448,336 people shows a mild negative correlation between the proportion of Bangladeshis and percentage of population with at least bachelor's degree education in the United States with a correlation coefficient (R) of -0.312 and weighted average of 30.2%. Similarly, the statistical analysis conducted on geographies consisting of 261,339,823 people shows a poor negative correlation between the proportion of Slovenes and percentage of population with at least bachelor's degree education in the United States with a correlation coefficient (R) of -0.146 and weighted average of 39.1%, a difference of 29.4%.
Bachelor's Degree Correlation Summary
| Measurement | Bangladeshi | Slovene |
| Minimum | 8.9% | 12.8% |
| Maximum | 42.8% | 64.4% |
| Range | 33.9% | 51.7% |
| Mean | 24.4% | 31.8% |
| Median | 23.4% | 30.9% |
| Interquartile 25% (IQ1) | 16.8% | 23.8% |
| Interquartile 75% (IQ3) | 31.7% | 38.5% |
| Interquartile Range (IQR) | 14.8% | 14.7% |
| Standard Deviation (Sample) | 8.6% | 10.6% |
| Standard Deviation (Population) | 8.6% | 10.5% |
Similar Demographics by Bachelor's Degree
Demographics Similar to Bangladeshis by Bachelor's Degree
In terms of bachelor's degree, the demographic groups most similar to Bangladeshis are Cherokee (30.2%, a difference of 0.010%), Mexican American Indian (30.2%, a difference of 0.17%), Immigrants from Latin America (30.1%, a difference of 0.43%), Immigrants from Cuba (30.3%, a difference of 0.45%), and Immigrants from Micronesia (30.4%, a difference of 0.66%).
| Demographics | Rating | Rank | Bachelor's Degree |
| Puget Sound Salish | 0.0 /100 | #296 | Tragic 30.7% |
| Immigrants | Haiti | 0.0 /100 | #297 | Tragic 30.6% |
| Chippewa | 0.0 /100 | #298 | Tragic 30.6% |
| Chickasaw | 0.0 /100 | #299 | Tragic 30.4% |
| Immigrants | Micronesia | 0.0 /100 | #300 | Tragic 30.4% |
| Immigrants | Cuba | 0.0 /100 | #301 | Tragic 30.3% |
| Mexican American Indians | 0.0 /100 | #302 | Tragic 30.2% |
| Bangladeshis | 0.0 /100 | #303 | Tragic 30.2% |
| Cherokee | 0.0 /100 | #304 | Tragic 30.2% |
| Immigrants | Latin America | 0.0 /100 | #305 | Tragic 30.1% |
| Immigrants | Yemen | 0.0 /100 | #306 | Tragic 29.9% |
| Nepalese | 0.0 /100 | #307 | Tragic 29.9% |
| Cajuns | 0.0 /100 | #308 | Tragic 29.6% |
| Hispanics or Latinos | 0.0 /100 | #309 | Tragic 29.6% |
| Cheyenne | 0.0 /100 | #310 | Tragic 29.4% |
Demographics Similar to Slovenes by Bachelor's Degree
In terms of bachelor's degree, the demographic groups most similar to Slovenes are Immigrants from Afghanistan (39.1%, a difference of 0.030%), Swedish (39.1%, a difference of 0.040%), Polish (39.1%, a difference of 0.050%), Immigrants from Sierra Leone (39.0%, a difference of 0.070%), and Iraqi (39.0%, a difference of 0.21%).
| Demographics | Rating | Rank | Bachelor's Degree |
| Europeans | 85.6 /100 | #138 | Excellent 39.5% |
| Immigrants | Sudan | 84.5 /100 | #139 | Excellent 39.4% |
| Immigrants | Armenia | 84.1 /100 | #140 | Excellent 39.4% |
| South American Indians | 83.6 /100 | #141 | Excellent 39.3% |
| Immigrants | North Macedonia | 81.6 /100 | #142 | Excellent 39.2% |
| Poles | 79.8 /100 | #143 | Good 39.1% |
| Immigrants | Afghanistan | 79.7 /100 | #144 | Good 39.1% |
| Slovenes | 79.5 /100 | #145 | Good 39.1% |
| Swedes | 79.2 /100 | #146 | Good 39.1% |
| Immigrants | Sierra Leone | 79.0 /100 | #147 | Good 39.0% |
| Iraqis | 78.1 /100 | #148 | Good 39.0% |
| Immigrants | Poland | 77.5 /100 | #149 | Good 39.0% |
| South Americans | 77.3 /100 | #150 | Good 38.9% |
| Immigrants | Africa | 76.5 /100 | #151 | Good 38.9% |
| Sudanese | 76.4 /100 | #152 | Good 38.9% |