South African vs Slovene Child Poverty Under the Age of 5
COMPARE
South African
Slovene
Child Poverty Under the Age of 5
Child Poverty Under the Age of 5 Comparison
South Africans
Slovenes
16.2%
CHILD POVERTY UNDER THE AGE OF 5
90.1/ 100
METRIC RATING
128th/ 347
METRIC RANK
16.0%
CHILD POVERTY UNDER THE AGE OF 5
94.4/ 100
METRIC RATING
107th/ 347
METRIC RANK
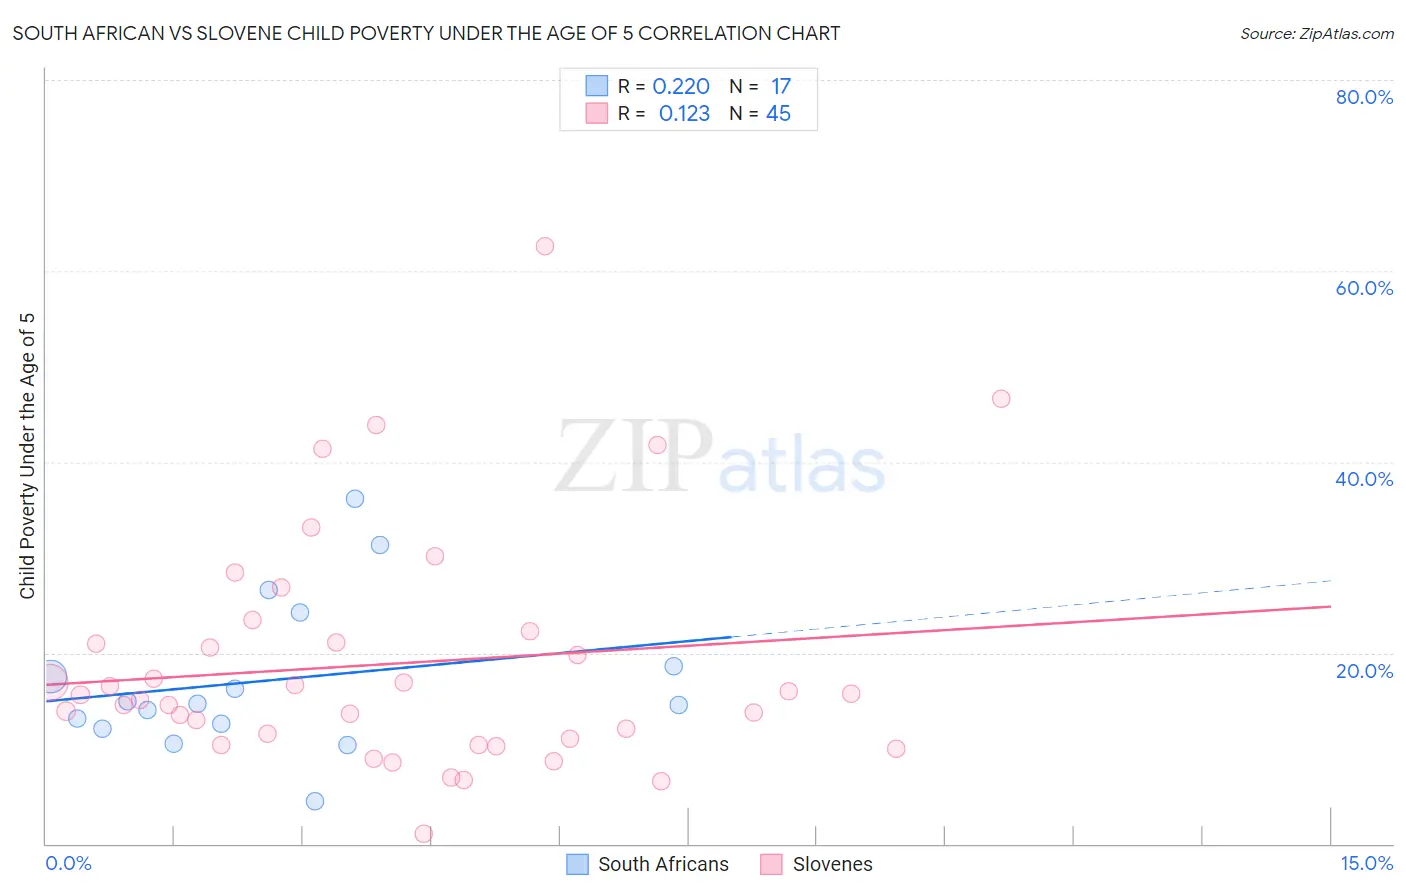
South African vs Slovene Child Poverty Under the Age of 5 Correlation Chart
The statistical analysis conducted on geographies consisting of 177,239,967 people shows a weak positive correlation between the proportion of South Africans and poverty level among children under the age of 5 in the United States with a correlation coefficient (R) of 0.220 and weighted average of 16.2%. Similarly, the statistical analysis conducted on geographies consisting of 251,690,205 people shows a poor positive correlation between the proportion of Slovenes and poverty level among children under the age of 5 in the United States with a correlation coefficient (R) of 0.123 and weighted average of 16.0%, a difference of 1.8%.
Child Poverty Under the Age of 5 Correlation Summary
| Measurement | South African | Slovene |
| Minimum | 4.4% | 1.0% |
| Maximum | 36.2% | 62.6% |
| Range | 31.8% | 61.6% |
| Mean | 17.2% | 18.9% |
| Median | 14.7% | 15.6% |
| Interquartile 25% (IQ1) | 12.3% | 10.7% |
| Interquartile 75% (IQ3) | 21.4% | 21.7% |
| Interquartile Range (IQR) | 9.1% | 11.0% |
| Standard Deviation (Sample) | 8.1% | 12.3% |
| Standard Deviation (Population) | 7.8% | 12.2% |
Similar Demographics by Child Poverty Under the Age of 5
Demographics Similar to South Africans by Child Poverty Under the Age of 5
In terms of child poverty under the age of 5, the demographic groups most similar to South Africans are British (16.3%, a difference of 0.18%), Immigrants from Norway (16.3%, a difference of 0.21%), Immigrants from England (16.2%, a difference of 0.49%), Finnish (16.3%, a difference of 0.51%), and Serbian (16.3%, a difference of 0.54%).
| Demographics | Rating | Rank | Child Poverty Under the Age of 5 |
| Mongolians | 92.5 /100 | #121 | Exceptional 16.1% |
| Immigrants | Southern Europe | 92.0 /100 | #122 | Exceptional 16.1% |
| Austrians | 92.0 /100 | #123 | Exceptional 16.1% |
| Swiss | 92.0 /100 | #124 | Exceptional 16.1% |
| Native Hawaiians | 91.8 /100 | #125 | Exceptional 16.2% |
| Immigrants | Albania | 91.8 /100 | #126 | Exceptional 16.2% |
| Immigrants | England | 91.5 /100 | #127 | Exceptional 16.2% |
| South Africans | 90.1 /100 | #128 | Exceptional 16.2% |
| British | 89.4 /100 | #129 | Excellent 16.3% |
| Immigrants | Norway | 89.3 /100 | #130 | Excellent 16.3% |
| Finns | 88.3 /100 | #131 | Excellent 16.3% |
| Serbians | 88.2 /100 | #132 | Excellent 16.3% |
| Icelanders | 87.9 /100 | #133 | Excellent 16.3% |
| Immigrants | North Macedonia | 87.8 /100 | #134 | Excellent 16.4% |
| Brazilians | 87.8 /100 | #135 | Excellent 16.4% |
Demographics Similar to Slovenes by Child Poverty Under the Age of 5
In terms of child poverty under the age of 5, the demographic groups most similar to Slovenes are Immigrants from Brazil (16.0%, a difference of 0.010%), Northern European (16.0%, a difference of 0.090%), Romanian (16.0%, a difference of 0.10%), Tlingit-Haida (15.9%, a difference of 0.14%), and Pakistani (16.0%, a difference of 0.14%).
| Demographics | Rating | Rank | Child Poverty Under the Age of 5 |
| Immigrants | Canada | 95.9 /100 | #100 | Exceptional 15.8% |
| Immigrants | Zimbabwe | 95.9 /100 | #101 | Exceptional 15.8% |
| Armenians | 95.7 /100 | #102 | Exceptional 15.8% |
| Europeans | 95.3 /100 | #103 | Exceptional 15.9% |
| Immigrants | North America | 94.9 /100 | #104 | Exceptional 15.9% |
| Immigrants | Spain | 94.8 /100 | #105 | Exceptional 15.9% |
| Tlingit-Haida | 94.7 /100 | #106 | Exceptional 15.9% |
| Slovenes | 94.4 /100 | #107 | Exceptional 16.0% |
| Immigrants | Brazil | 94.4 /100 | #108 | Exceptional 16.0% |
| Northern Europeans | 94.3 /100 | #109 | Exceptional 16.0% |
| Romanians | 94.3 /100 | #110 | Exceptional 16.0% |
| Pakistanis | 94.2 /100 | #111 | Exceptional 16.0% |
| Peruvians | 94.1 /100 | #112 | Exceptional 16.0% |
| Puget Sound Salish | 94.1 /100 | #113 | Exceptional 16.0% |
| Immigrants | Kuwait | 93.9 /100 | #114 | Exceptional 16.0% |