Austrian vs Immigrants from Congo Child Poverty Among Girls Under 16
COMPARE
Austrian
Immigrants from Congo
Child Poverty Among Girls Under 16
Child Poverty Among Girls Under 16 Comparison
Austrians
Immigrants from Congo
14.9%
CHILD POVERTY AMONG GIRLS UNDER 16
96.7/ 100
METRIC RATING
92nd/ 347
METRIC RANK
22.7%
CHILD POVERTY AMONG GIRLS UNDER 16
0.0/ 100
METRIC RATING
325th/ 347
METRIC RANK
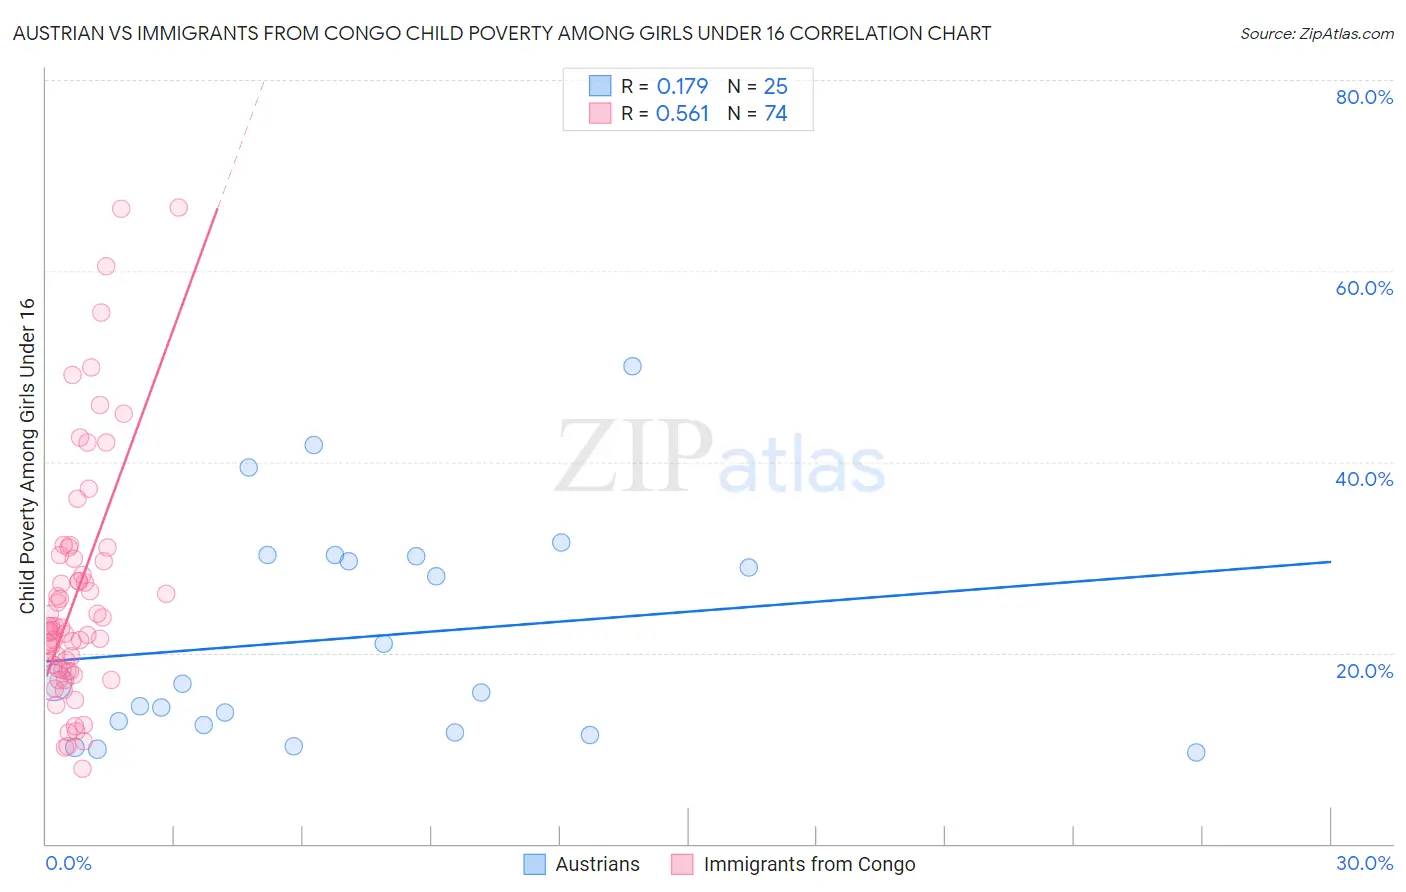
Austrian vs Immigrants from Congo Child Poverty Among Girls Under 16 Correlation Chart
The statistical analysis conducted on geographies consisting of 439,542,815 people shows a poor positive correlation between the proportion of Austrians and poverty level among girls under the age of 16 in the United States with a correlation coefficient (R) of 0.179 and weighted average of 14.9%. Similarly, the statistical analysis conducted on geographies consisting of 91,922,070 people shows a substantial positive correlation between the proportion of Immigrants from Congo and poverty level among girls under the age of 16 in the United States with a correlation coefficient (R) of 0.561 and weighted average of 22.7%, a difference of 52.9%.
Child Poverty Among Girls Under 16 Correlation Summary
| Measurement | Austrian | Immigrants from Congo |
| Minimum | 9.5% | 7.9% |
| Maximum | 50.0% | 66.7% |
| Range | 40.5% | 58.8% |
| Mean | 21.6% | 26.1% |
| Median | 16.7% | 22.5% |
| Interquartile 25% (IQ1) | 12.1% | 18.2% |
| Interquartile 75% (IQ3) | 30.2% | 29.8% |
| Interquartile Range (IQR) | 18.1% | 11.7% |
| Standard Deviation (Sample) | 11.5% | 12.7% |
| Standard Deviation (Population) | 11.3% | 12.6% |
Similar Demographics by Child Poverty Among Girls Under 16
Demographics Similar to Austrians by Child Poverty Among Girls Under 16
In terms of child poverty among girls under 16, the demographic groups most similar to Austrians are Immigrants from North America (14.9%, a difference of 0.070%), Immigrants from Switzerland (14.9%, a difference of 0.34%), Immigrants from Belarus (14.8%, a difference of 0.35%), German (14.9%, a difference of 0.36%), and Northern European (14.8%, a difference of 0.39%).
| Demographics | Rating | Rank | Child Poverty Among Girls Under 16 |
| Swiss | 97.2 /100 | #85 | Exceptional 14.8% |
| Australians | 97.2 /100 | #86 | Exceptional 14.8% |
| Finns | 97.2 /100 | #87 | Exceptional 14.8% |
| Immigrants | Canada | 97.1 /100 | #88 | Exceptional 14.8% |
| Jordanians | 97.1 /100 | #89 | Exceptional 14.8% |
| Northern Europeans | 97.0 /100 | #90 | Exceptional 14.8% |
| Immigrants | Belarus | 97.0 /100 | #91 | Exceptional 14.8% |
| Austrians | 96.7 /100 | #92 | Exceptional 14.9% |
| Immigrants | North America | 96.6 /100 | #93 | Exceptional 14.9% |
| Immigrants | Switzerland | 96.3 /100 | #94 | Exceptional 14.9% |
| Germans | 96.3 /100 | #95 | Exceptional 14.9% |
| Immigrants | France | 96.2 /100 | #96 | Exceptional 14.9% |
| Immigrants | Latvia | 96.1 /100 | #97 | Exceptional 14.9% |
| Basques | 95.9 /100 | #98 | Exceptional 15.0% |
| Immigrants | Egypt | 95.7 /100 | #99 | Exceptional 15.0% |
Demographics Similar to Immigrants from Congo by Child Poverty Among Girls Under 16
In terms of child poverty among girls under 16, the demographic groups most similar to Immigrants from Congo are Immigrants from Honduras (22.8%, a difference of 0.13%), Central American Indian (22.8%, a difference of 0.27%), Paiute (22.6%, a difference of 0.50%), Cajun (22.6%, a difference of 0.79%), and Yakama (22.6%, a difference of 0.80%).
| Demographics | Rating | Rank | Child Poverty Among Girls Under 16 |
| Immigrants | Dominica | 0.0 /100 | #318 | Tragic 22.1% |
| U.S. Virgin Islanders | 0.0 /100 | #319 | Tragic 22.1% |
| Hondurans | 0.0 /100 | #320 | Tragic 22.2% |
| Colville | 0.0 /100 | #321 | Tragic 22.5% |
| Yakama | 0.0 /100 | #322 | Tragic 22.6% |
| Cajuns | 0.0 /100 | #323 | Tragic 22.6% |
| Paiute | 0.0 /100 | #324 | Tragic 22.6% |
| Immigrants | Congo | 0.0 /100 | #325 | Tragic 22.7% |
| Immigrants | Honduras | 0.0 /100 | #326 | Tragic 22.8% |
| Central American Indians | 0.0 /100 | #327 | Tragic 22.8% |
| Dominicans | 0.0 /100 | #328 | Tragic 23.7% |
| Kiowa | 0.0 /100 | #329 | Tragic 23.7% |
| Immigrants | Dominican Republic | 0.0 /100 | #330 | Tragic 23.8% |
| Apache | 0.0 /100 | #331 | Tragic 23.8% |
| Natives/Alaskans | 0.0 /100 | #332 | Tragic 24.0% |