Immigrants from Sierra Leone vs Indonesian Single Mother Poverty
COMPARE
Immigrants from Sierra Leone
Indonesian
Single Mother Poverty
Single Mother Poverty Comparison
Immigrants from Sierra Leone
Indonesians
26.9%
SINGLE MOTHER POVERTY
99.9/ 100
METRIC RATING
44th/ 347
METRIC RANK
32.4%
SINGLE MOTHER POVERTY
0.0/ 100
METRIC RATING
284th/ 347
METRIC RANK
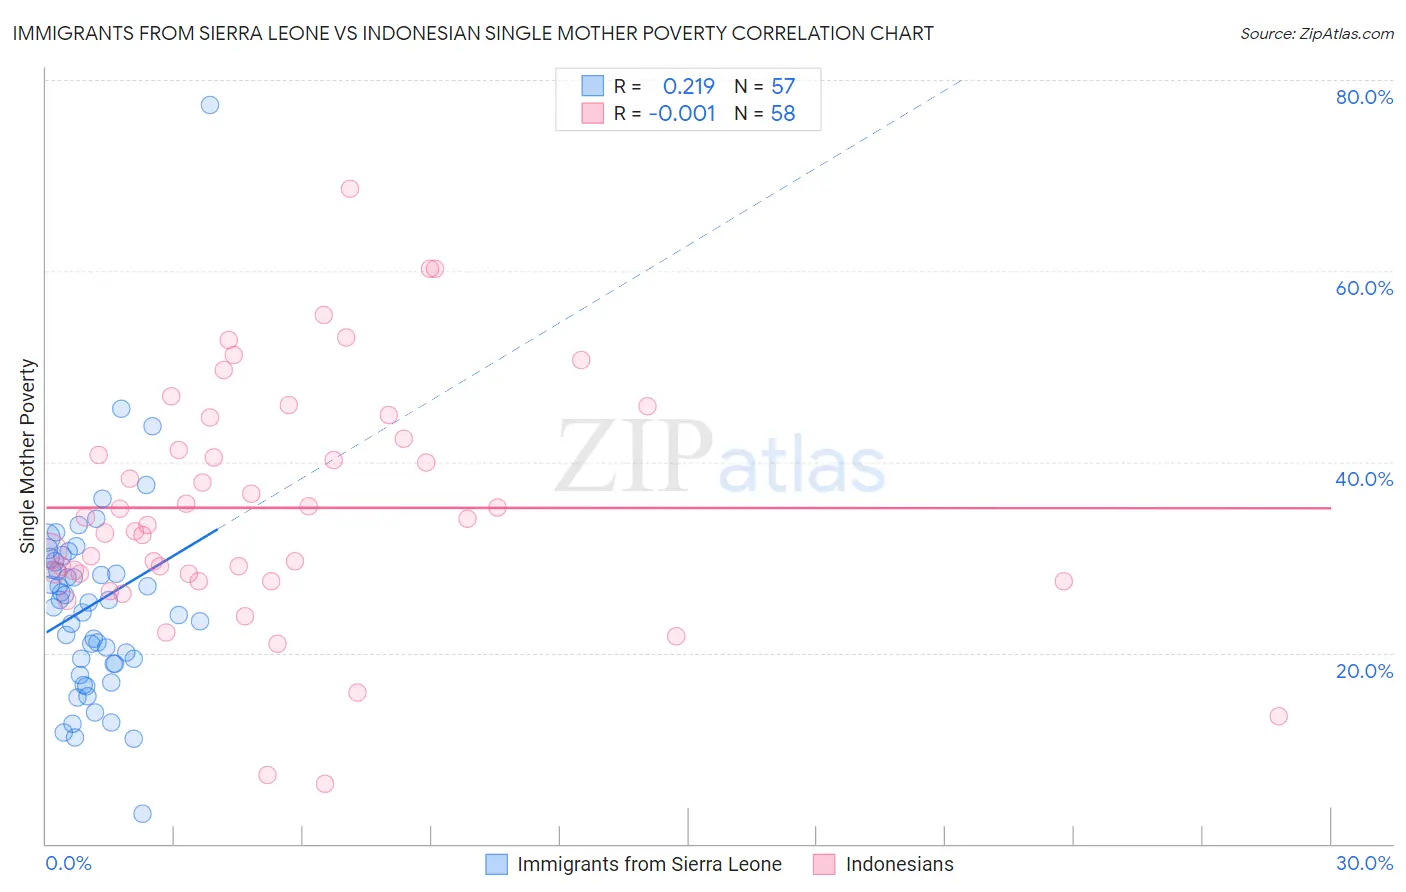
Immigrants from Sierra Leone vs Indonesian Single Mother Poverty Correlation Chart
The statistical analysis conducted on geographies consisting of 101,102,212 people shows a weak positive correlation between the proportion of Immigrants from Sierra Leone and poverty level among single mothers in the United States with a correlation coefficient (R) of 0.219 and weighted average of 26.9%. Similarly, the statistical analysis conducted on geographies consisting of 161,147,773 people shows no correlation between the proportion of Indonesians and poverty level among single mothers in the United States with a correlation coefficient (R) of -0.001 and weighted average of 32.4%, a difference of 20.6%.
Single Mother Poverty Correlation Summary
| Measurement | Immigrants from Sierra Leone | Indonesian |
| Minimum | 3.1% | 6.2% |
| Maximum | 77.3% | 68.6% |
| Range | 74.2% | 62.4% |
| Mean | 25.1% | 35.2% |
| Median | 25.2% | 33.7% |
| Interquartile 25% (IQ1) | 18.9% | 28.2% |
| Interquartile 75% (IQ3) | 29.7% | 42.4% |
| Interquartile Range (IQR) | 10.9% | 14.2% |
| Standard Deviation (Sample) | 10.8% | 12.5% |
| Standard Deviation (Population) | 10.7% | 12.4% |
Similar Demographics by Single Mother Poverty
Demographics Similar to Immigrants from Sierra Leone by Single Mother Poverty
In terms of single mother poverty, the demographic groups most similar to Immigrants from Sierra Leone are Latvian (26.9%, a difference of 0.070%), Immigrants from Serbia (26.9%, a difference of 0.12%), Tsimshian (26.8%, a difference of 0.14%), Egyptian (26.9%, a difference of 0.18%), and Armenian (26.8%, a difference of 0.22%).
| Demographics | Rating | Rank | Single Mother Poverty |
| Immigrants | Israel | 99.9 /100 | #37 | Exceptional 26.6% |
| Immigrants | Fiji | 99.9 /100 | #38 | Exceptional 26.6% |
| Sri Lankans | 99.9 /100 | #39 | Exceptional 26.7% |
| Immigrants | Vietnam | 99.9 /100 | #40 | Exceptional 26.7% |
| Immigrants | Greece | 99.9 /100 | #41 | Exceptional 26.7% |
| Armenians | 99.9 /100 | #42 | Exceptional 26.8% |
| Tsimshian | 99.9 /100 | #43 | Exceptional 26.8% |
| Immigrants | Sierra Leone | 99.9 /100 | #44 | Exceptional 26.9% |
| Latvians | 99.9 /100 | #45 | Exceptional 26.9% |
| Immigrants | Serbia | 99.9 /100 | #46 | Exceptional 26.9% |
| Egyptians | 99.8 /100 | #47 | Exceptional 26.9% |
| Immigrants | Poland | 99.8 /100 | #48 | Exceptional 26.9% |
| Cambodians | 99.8 /100 | #49 | Exceptional 27.0% |
| Laotians | 99.8 /100 | #50 | Exceptional 27.0% |
| Immigrants | Argentina | 99.7 /100 | #51 | Exceptional 27.1% |
Demographics Similar to Indonesians by Single Mother Poverty
In terms of single mother poverty, the demographic groups most similar to Indonesians are Immigrants from Latin America (32.4%, a difference of 0.11%), Yup'ik (32.5%, a difference of 0.19%), Spanish American (32.3%, a difference of 0.30%), Immigrants from Dominica (32.5%, a difference of 0.31%), and Somali (32.6%, a difference of 0.54%).
| Demographics | Rating | Rank | Single Mother Poverty |
| Mexican American Indians | 0.0 /100 | #277 | Tragic 31.9% |
| Immigrants | Zaire | 0.0 /100 | #278 | Tragic 32.0% |
| Marshallese | 0.0 /100 | #279 | Tragic 32.1% |
| Immigrants | Nonimmigrants | 0.0 /100 | #280 | Tragic 32.2% |
| Cree | 0.0 /100 | #281 | Tragic 32.2% |
| Immigrants | Azores | 0.0 /100 | #282 | Tragic 32.2% |
| Spanish Americans | 0.0 /100 | #283 | Tragic 32.3% |
| Indonesians | 0.0 /100 | #284 | Tragic 32.4% |
| Immigrants | Latin America | 0.0 /100 | #285 | Tragic 32.4% |
| Yup'ik | 0.0 /100 | #286 | Tragic 32.5% |
| Immigrants | Dominica | 0.0 /100 | #287 | Tragic 32.5% |
| Somalis | 0.0 /100 | #288 | Tragic 32.6% |
| U.S. Virgin Islanders | 0.0 /100 | #289 | Tragic 32.6% |
| Osage | 0.0 /100 | #290 | Tragic 32.6% |
| Guatemalans | 0.0 /100 | #291 | Tragic 32.9% |