Asian vs Indonesian 5th Grade
COMPARE
Asian
Indonesian
5th Grade
5th Grade Comparison
Asians
Indonesians
96.9%
5TH GRADE
2.0/ 100
METRIC RATING
238th/ 347
METRIC RANK
96.0%
5TH GRADE
0.0/ 100
METRIC RATING
310th/ 347
METRIC RANK
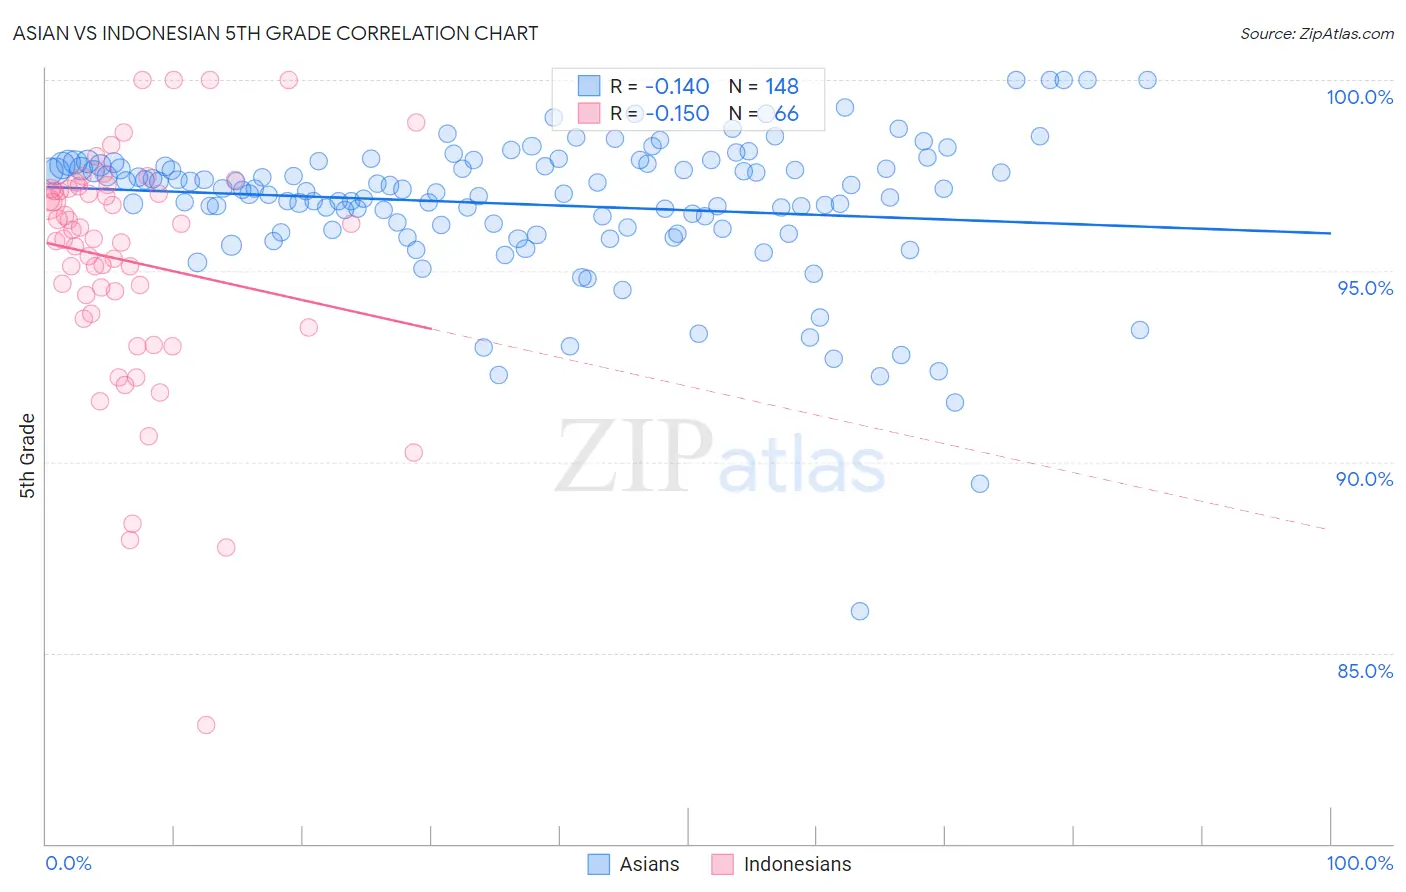
Asian vs Indonesian 5th Grade Correlation Chart
The statistical analysis conducted on geographies consisting of 550,860,618 people shows a poor negative correlation between the proportion of Asians and percentage of population with at least 5th grade education in the United States with a correlation coefficient (R) of -0.140 and weighted average of 96.9%. Similarly, the statistical analysis conducted on geographies consisting of 162,727,113 people shows a poor negative correlation between the proportion of Indonesians and percentage of population with at least 5th grade education in the United States with a correlation coefficient (R) of -0.150 and weighted average of 96.0%, a difference of 1.0%.
5th Grade Correlation Summary
| Measurement | Asian | Indonesian |
| Minimum | 86.1% | 83.1% |
| Maximum | 100.0% | 100.0% |
| Range | 13.9% | 16.9% |
| Mean | 96.7% | 95.3% |
| Median | 97.1% | 96.0% |
| Interquartile 25% (IQ1) | 96.1% | 93.9% |
| Interquartile 75% (IQ3) | 97.8% | 97.1% |
| Interquartile Range (IQR) | 1.7% | 3.3% |
| Standard Deviation (Sample) | 1.9% | 3.1% |
| Standard Deviation (Population) | 1.9% | 3.1% |
Similar Demographics by 5th Grade
Demographics Similar to Asians by 5th Grade
In terms of 5th grade, the demographic groups most similar to Asians are Immigrants from Indonesia (96.9%, a difference of 0.0%), Nigerian (96.9%, a difference of 0.0%), Indian (Asian) (96.9%, a difference of 0.0%), Immigrants from Asia (96.9%, a difference of 0.020%), and Immigrants from Costa Rica (96.9%, a difference of 0.020%).
| Demographics | Rating | Rank | 5th Grade |
| Immigrants | Malaysia | 4.1 /100 | #231 | Tragic 97.0% |
| Immigrants | Eastern Asia | 4.0 /100 | #232 | Tragic 97.0% |
| Sub-Saharan Africans | 3.3 /100 | #233 | Tragic 97.0% |
| Tohono O'odham | 3.2 /100 | #234 | Tragic 97.0% |
| Uruguayans | 3.2 /100 | #235 | Tragic 97.0% |
| Senegalese | 2.8 /100 | #236 | Tragic 97.0% |
| Immigrants | Indonesia | 2.0 /100 | #237 | Tragic 96.9% |
| Asians | 2.0 /100 | #238 | Tragic 96.9% |
| Nigerians | 1.9 /100 | #239 | Tragic 96.9% |
| Indians (Asian) | 1.9 /100 | #240 | Tragic 96.9% |
| Immigrants | Asia | 1.7 /100 | #241 | Tragic 96.9% |
| Immigrants | Costa Rica | 1.6 /100 | #242 | Tragic 96.9% |
| Immigrants | Eastern Africa | 1.6 /100 | #243 | Tragic 96.9% |
| Koreans | 1.6 /100 | #244 | Tragic 96.9% |
| Colombians | 1.3 /100 | #245 | Tragic 96.9% |
Demographics Similar to Indonesians by 5th Grade
In terms of 5th grade, the demographic groups most similar to Indonesians are Immigrants from Bangladesh (96.0%, a difference of 0.020%), Immigrants from Guyana (96.0%, a difference of 0.040%), Ecuadorian (96.0%, a difference of 0.050%), Vietnamese (95.9%, a difference of 0.050%), and Immigrants from Haiti (96.0%, a difference of 0.060%).
| Demographics | Rating | Rank | 5th Grade |
| Puerto Ricans | 0.0 /100 | #303 | Tragic 96.1% |
| Immigrants | Burma/Myanmar | 0.0 /100 | #304 | Tragic 96.1% |
| Immigrants | Laos | 0.0 /100 | #305 | Tragic 96.0% |
| Immigrants | Haiti | 0.0 /100 | #306 | Tragic 96.0% |
| Immigrants | Caribbean | 0.0 /100 | #307 | Tragic 96.0% |
| Ecuadorians | 0.0 /100 | #308 | Tragic 96.0% |
| Immigrants | Guyana | 0.0 /100 | #309 | Tragic 96.0% |
| Indonesians | 0.0 /100 | #310 | Tragic 96.0% |
| Immigrants | Bangladesh | 0.0 /100 | #311 | Tragic 96.0% |
| Vietnamese | 0.0 /100 | #312 | Tragic 95.9% |
| Bangladeshis | 0.0 /100 | #313 | Tragic 95.9% |
| Immigrants | Portugal | 0.0 /100 | #314 | Tragic 95.9% |
| Nicaraguans | 0.0 /100 | #315 | Tragic 95.9% |
| Immigrants | Ecuador | 0.0 /100 | #316 | Tragic 95.8% |
| Belizeans | 0.0 /100 | #317 | Tragic 95.8% |