Armenian vs Immigrants from Argentina Seniors Poverty Over the Age of 65
COMPARE
Armenian
Immigrants from Argentina
Seniors Poverty Over the Age of 65
Seniors Poverty Over the Age of 65 Comparison
Armenians
Immigrants from Argentina
12.3%
SENIORS POVERTY OVER THE AGE OF 65
0.3/ 100
METRIC RATING
252nd/ 347
METRIC RANK
12.0%
SENIORS POVERTY OVER THE AGE OF 65
1.3/ 100
METRIC RATING
235th/ 347
METRIC RANK
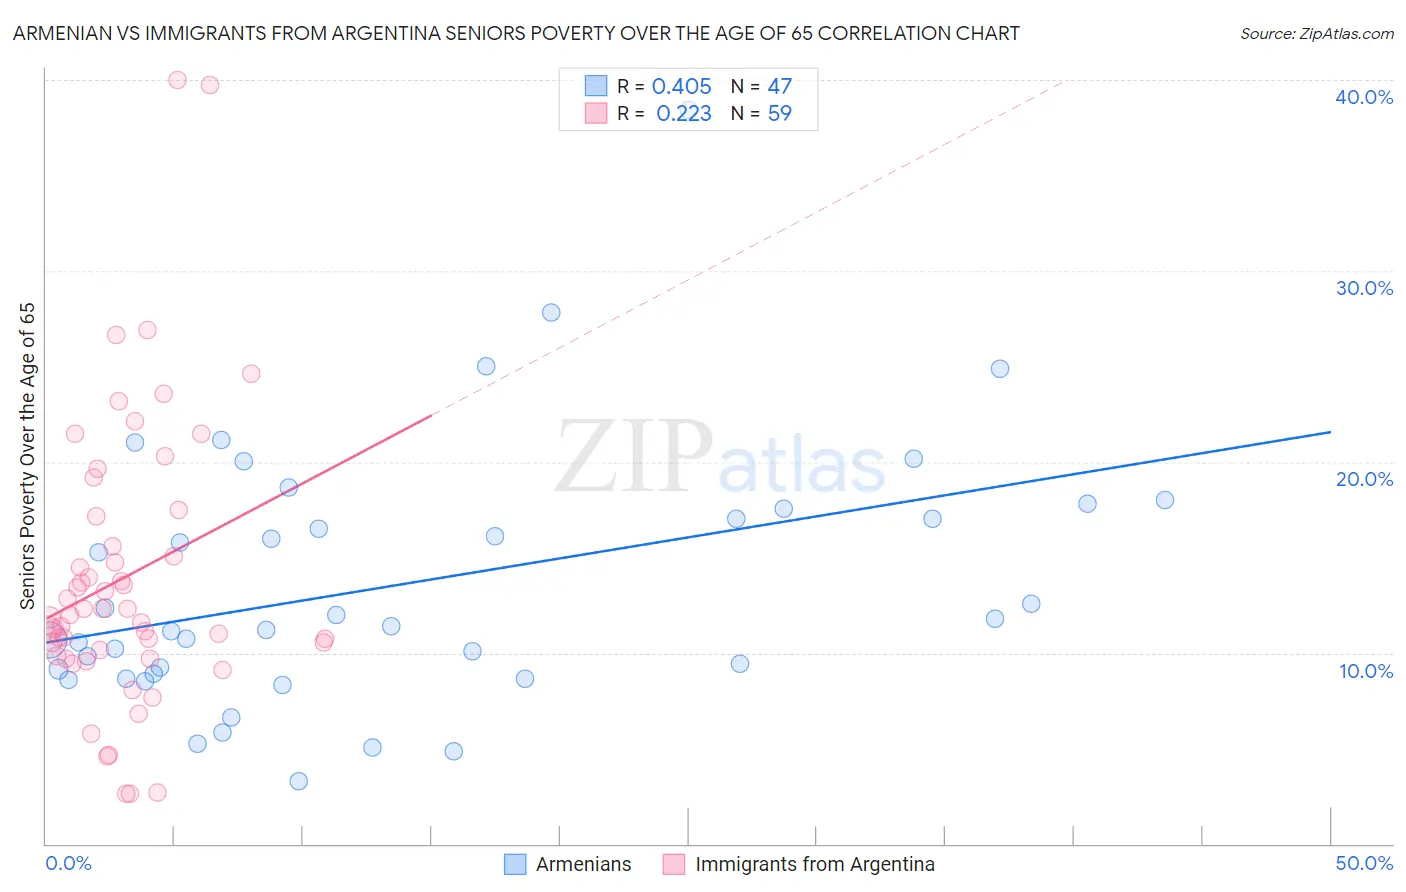
Armenian vs Immigrants from Argentina Seniors Poverty Over the Age of 65 Correlation Chart
The statistical analysis conducted on geographies consisting of 310,185,969 people shows a moderate positive correlation between the proportion of Armenians and poverty level among seniors over the age of 65 in the United States with a correlation coefficient (R) of 0.405 and weighted average of 12.3%. Similarly, the statistical analysis conducted on geographies consisting of 263,959,531 people shows a weak positive correlation between the proportion of Immigrants from Argentina and poverty level among seniors over the age of 65 in the United States with a correlation coefficient (R) of 0.223 and weighted average of 12.0%, a difference of 2.9%.
Seniors Poverty Over the Age of 65 Correlation Summary
| Measurement | Armenian | Immigrants from Argentina |
| Minimum | 3.3% | 2.6% |
| Maximum | 38.5% | 40.0% |
| Range | 35.2% | 37.4% |
| Mean | 13.6% | 14.0% |
| Median | 11.4% | 12.0% |
| Interquartile 25% (IQ1) | 8.9% | 9.8% |
| Interquartile 75% (IQ3) | 17.6% | 17.2% |
| Interquartile Range (IQR) | 8.7% | 7.3% |
| Standard Deviation (Sample) | 6.8% | 7.5% |
| Standard Deviation (Population) | 6.7% | 7.5% |
Demographics Similar to Armenians and Immigrants from Argentina by Seniors Poverty Over the Age of 65
In terms of seniors poverty over the age of 65, the demographic groups most similar to Armenians are Somali (12.3%, a difference of 0.11%), Shoshone (12.3%, a difference of 0.13%), Immigrants from Liberia (12.2%, a difference of 0.92%), Ute (12.2%, a difference of 1.3%), and Spanish American (12.2%, a difference of 1.3%). Similarly, the demographic groups most similar to Immigrants from Argentina are Immigrants from Peru (12.0%, a difference of 0.030%), Moroccan (12.0%, a difference of 0.18%), Seminole (12.0%, a difference of 0.40%), Iroquois (11.9%, a difference of 0.50%), and Panamanian (11.9%, a difference of 0.59%).
| Demographics | Rating | Rank | Seniors Poverty Over the Age of 65 |
| Panamanians | 1.8 /100 | #233 | Tragic 11.9% |
| Iroquois | 1.7 /100 | #234 | Tragic 11.9% |
| Immigrants | Argentina | 1.3 /100 | #235 | Tragic 12.0% |
| Immigrants | Peru | 1.3 /100 | #236 | Tragic 12.0% |
| Moroccans | 1.2 /100 | #237 | Tragic 12.0% |
| Seminole | 1.1 /100 | #238 | Tragic 12.0% |
| Immigrants | Spain | 1.0 /100 | #239 | Tragic 12.1% |
| Comanche | 0.9 /100 | #240 | Tragic 12.1% |
| Immigrants | Albania | 0.9 /100 | #241 | Tragic 12.1% |
| Sub-Saharan Africans | 0.9 /100 | #242 | Tragic 12.1% |
| Uruguayans | 0.8 /100 | #243 | Tragic 12.1% |
| Immigrants | Portugal | 0.8 /100 | #244 | Tragic 12.1% |
| Chippewa | 0.7 /100 | #245 | Tragic 12.1% |
| Cree | 0.7 /100 | #246 | Tragic 12.1% |
| Japanese | 0.6 /100 | #247 | Tragic 12.2% |
| Spanish Americans | 0.6 /100 | #248 | Tragic 12.2% |
| Ute | 0.6 /100 | #249 | Tragic 12.2% |
| Immigrants | Liberia | 0.5 /100 | #250 | Tragic 12.2% |
| Somalis | 0.3 /100 | #251 | Tragic 12.3% |
| Armenians | 0.3 /100 | #252 | Tragic 12.3% |
| Shoshone | 0.3 /100 | #253 | Tragic 12.3% |