Armenian vs Immigrants from Uruguay Seniors Poverty Over the Age of 65
COMPARE
Armenian
Immigrants from Uruguay
Seniors Poverty Over the Age of 65
Seniors Poverty Over the Age of 65 Comparison
Armenians
Immigrants from Uruguay
12.3%
SENIORS POVERTY OVER THE AGE OF 65
0.3/ 100
METRIC RATING
252nd/ 347
METRIC RANK
12.8%
SENIORS POVERTY OVER THE AGE OF 65
0.1/ 100
METRIC RATING
272nd/ 347
METRIC RANK
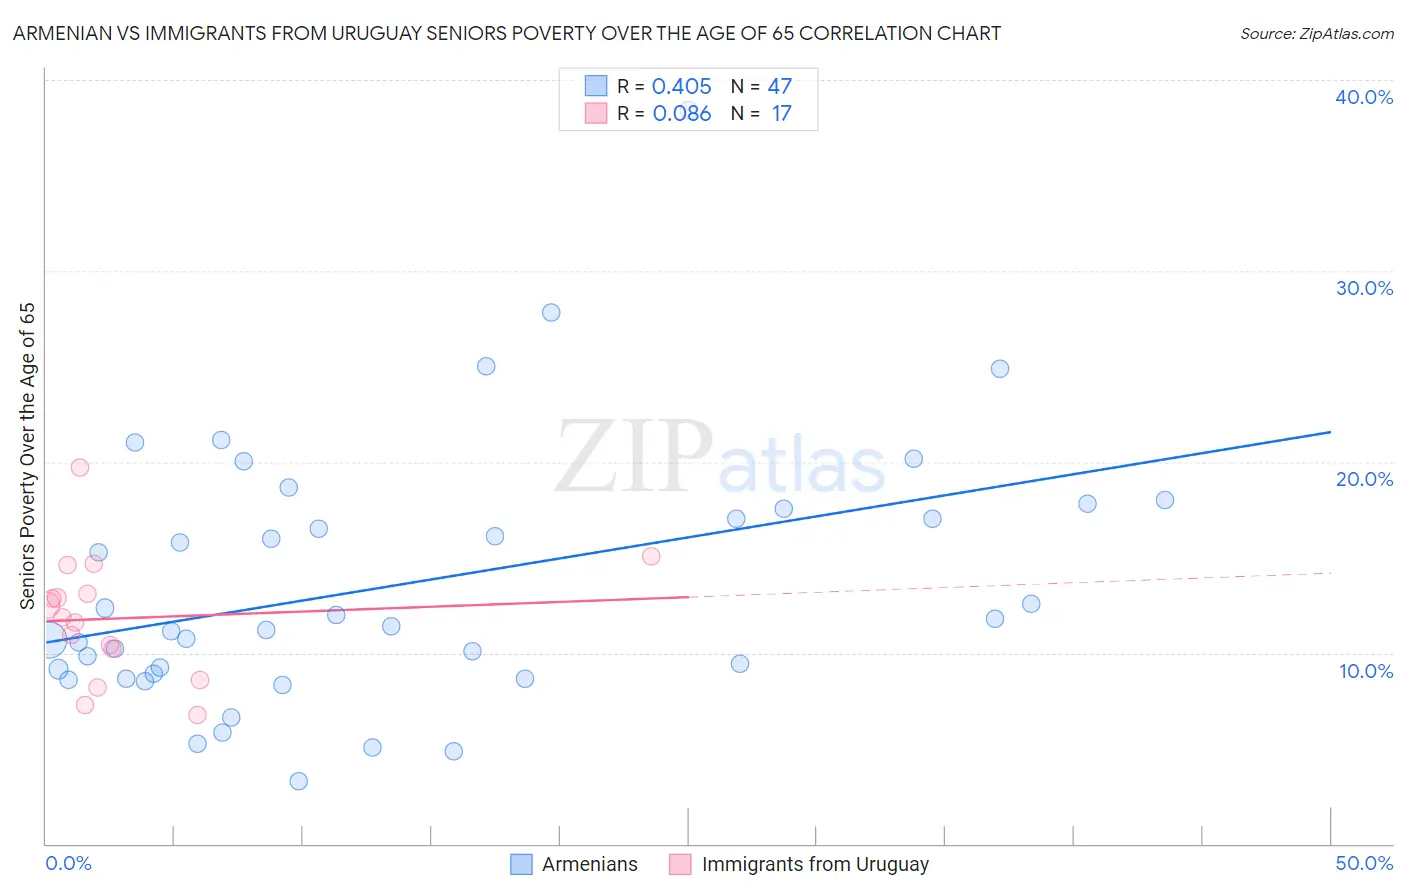
Armenian vs Immigrants from Uruguay Seniors Poverty Over the Age of 65 Correlation Chart
The statistical analysis conducted on geographies consisting of 310,185,969 people shows a moderate positive correlation between the proportion of Armenians and poverty level among seniors over the age of 65 in the United States with a correlation coefficient (R) of 0.405 and weighted average of 12.3%. Similarly, the statistical analysis conducted on geographies consisting of 133,160,147 people shows a slight positive correlation between the proportion of Immigrants from Uruguay and poverty level among seniors over the age of 65 in the United States with a correlation coefficient (R) of 0.086 and weighted average of 12.8%, a difference of 3.6%.
Seniors Poverty Over the Age of 65 Correlation Summary
| Measurement | Armenian | Immigrants from Uruguay |
| Minimum | 3.3% | 6.7% |
| Maximum | 38.5% | 19.7% |
| Range | 35.2% | 12.9% |
| Mean | 13.6% | 11.8% |
| Median | 11.4% | 11.8% |
| Interquartile 25% (IQ1) | 8.9% | 9.4% |
| Interquartile 75% (IQ3) | 17.6% | 13.8% |
| Interquartile Range (IQR) | 8.7% | 4.4% |
| Standard Deviation (Sample) | 6.8% | 3.2% |
| Standard Deviation (Population) | 6.7% | 3.1% |
Demographics Similar to Armenians and Immigrants from Uruguay by Seniors Poverty Over the Age of 65
In terms of seniors poverty over the age of 65, the demographic groups most similar to Armenians are Shoshone (12.3%, a difference of 0.13%), Immigrants from Cambodia (12.4%, a difference of 0.35%), Mexican American Indian (12.4%, a difference of 0.48%), Immigrants from Panama (12.4%, a difference of 0.71%), and Immigrants (12.4%, a difference of 0.72%). Similarly, the demographic groups most similar to Immigrants from Uruguay are Immigrants from Ghana (12.8%, a difference of 0.030%), Immigrants from South America (12.7%, a difference of 0.30%), Immigrants from Venezuela (12.7%, a difference of 0.55%), Immigrants from Somalia (12.6%, a difference of 1.1%), and Blackfeet (12.6%, a difference of 1.3%).
| Demographics | Rating | Rank | Seniors Poverty Over the Age of 65 |
| Armenians | 0.3 /100 | #252 | Tragic 12.3% |
| Shoshone | 0.3 /100 | #253 | Tragic 12.3% |
| Immigrants | Cambodia | 0.3 /100 | #254 | Tragic 12.4% |
| Mexican American Indians | 0.3 /100 | #255 | Tragic 12.4% |
| Immigrants | Panama | 0.2 /100 | #256 | Tragic 12.4% |
| Immigrants | Immigrants | 0.2 /100 | #257 | Tragic 12.4% |
| Dutch West Indians | 0.2 /100 | #258 | Tragic 12.4% |
| Ghanaians | 0.2 /100 | #259 | Tragic 12.4% |
| South Americans | 0.2 /100 | #260 | Tragic 12.5% |
| Colombians | 0.2 /100 | #261 | Tragic 12.5% |
| Venezuelans | 0.1 /100 | #262 | Tragic 12.5% |
| Soviet Union | 0.1 /100 | #263 | Tragic 12.6% |
| Inupiat | 0.1 /100 | #264 | Tragic 12.6% |
| Immigrants | Western Africa | 0.1 /100 | #265 | Tragic 12.6% |
| Africans | 0.1 /100 | #266 | Tragic 12.6% |
| Blackfeet | 0.1 /100 | #267 | Tragic 12.6% |
| Immigrants | Somalia | 0.1 /100 | #268 | Tragic 12.6% |
| Immigrants | Venezuela | 0.1 /100 | #269 | Tragic 12.7% |
| Immigrants | South America | 0.1 /100 | #270 | Tragic 12.7% |
| Immigrants | Ghana | 0.1 /100 | #271 | Tragic 12.8% |
| Immigrants | Uruguay | 0.1 /100 | #272 | Tragic 12.8% |