Armenian vs Sri Lankan Seniors Poverty Over the Age of 65
COMPARE
Armenian
Sri Lankan
Seniors Poverty Over the Age of 65
Seniors Poverty Over the Age of 65 Comparison
Armenians
Sri Lankans
12.3%
SENIORS POVERTY OVER THE AGE OF 65
0.3/ 100
METRIC RATING
252nd/ 347
METRIC RANK
10.9%
SENIORS POVERTY OVER THE AGE OF 65
56.8/ 100
METRIC RATING
169th/ 347
METRIC RANK
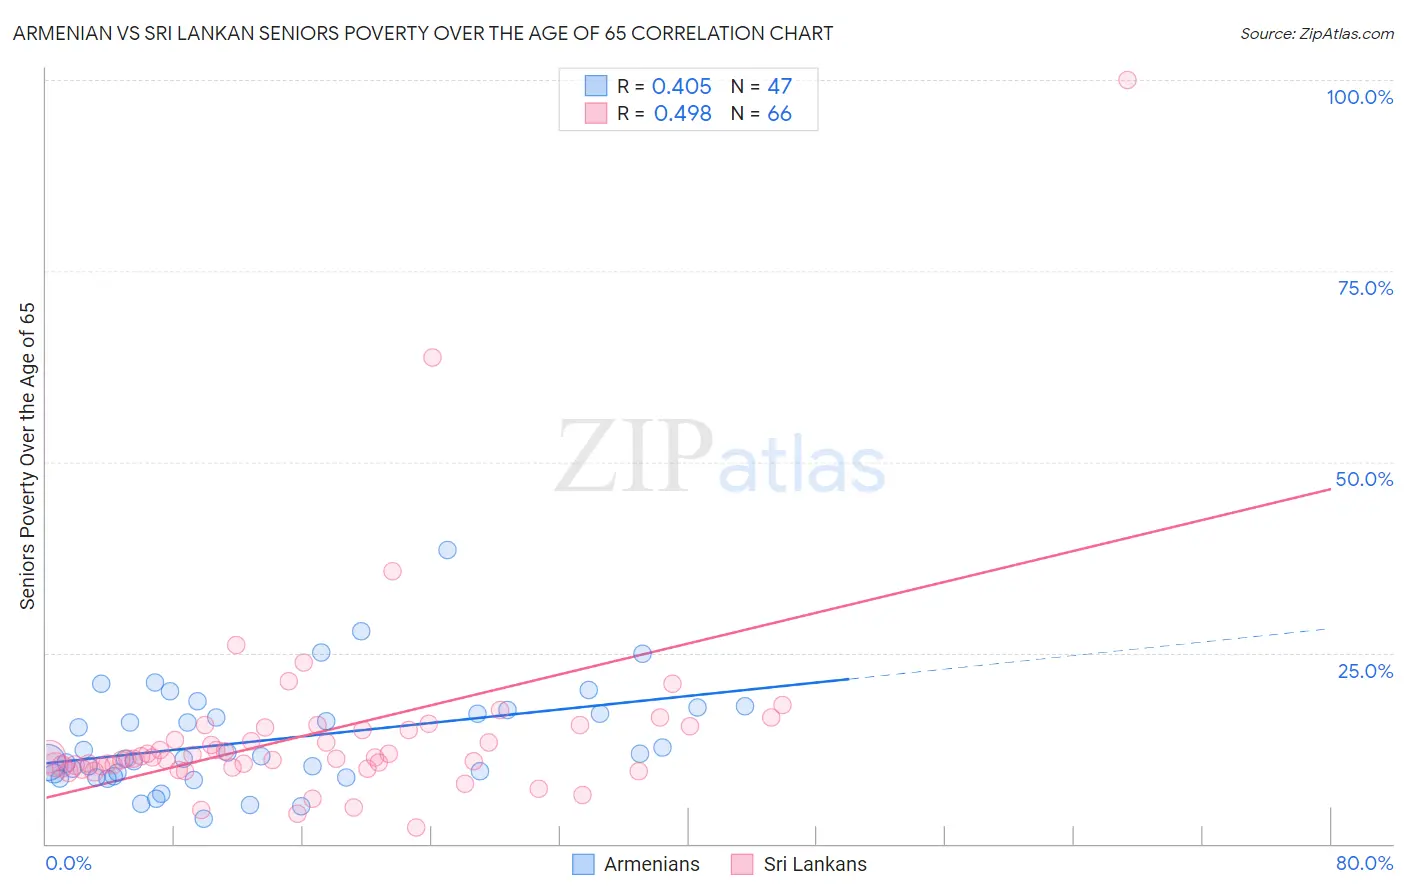
Armenian vs Sri Lankan Seniors Poverty Over the Age of 65 Correlation Chart
The statistical analysis conducted on geographies consisting of 310,185,969 people shows a moderate positive correlation between the proportion of Armenians and poverty level among seniors over the age of 65 in the United States with a correlation coefficient (R) of 0.405 and weighted average of 12.3%. Similarly, the statistical analysis conducted on geographies consisting of 438,555,706 people shows a moderate positive correlation between the proportion of Sri Lankans and poverty level among seniors over the age of 65 in the United States with a correlation coefficient (R) of 0.498 and weighted average of 10.9%, a difference of 13.4%.
Seniors Poverty Over the Age of 65 Correlation Summary
| Measurement | Armenian | Sri Lankan |
| Minimum | 3.3% | 2.1% |
| Maximum | 38.5% | 100.0% |
| Range | 35.2% | 97.9% |
| Mean | 13.6% | 14.5% |
| Median | 11.4% | 11.3% |
| Interquartile 25% (IQ1) | 8.9% | 10.1% |
| Interquartile 75% (IQ3) | 17.6% | 15.2% |
| Interquartile Range (IQR) | 8.7% | 5.1% |
| Standard Deviation (Sample) | 6.8% | 13.4% |
| Standard Deviation (Population) | 6.7% | 13.3% |
Similar Demographics by Seniors Poverty Over the Age of 65
Demographics Similar to Armenians by Seniors Poverty Over the Age of 65
In terms of seniors poverty over the age of 65, the demographic groups most similar to Armenians are Somali (12.3%, a difference of 0.11%), Shoshone (12.3%, a difference of 0.13%), Immigrants from Cambodia (12.4%, a difference of 0.35%), Mexican American Indian (12.4%, a difference of 0.48%), and Immigrants from Panama (12.4%, a difference of 0.71%).
| Demographics | Rating | Rank | Seniors Poverty Over the Age of 65 |
| Chippewa | 0.7 /100 | #245 | Tragic 12.1% |
| Cree | 0.7 /100 | #246 | Tragic 12.1% |
| Japanese | 0.6 /100 | #247 | Tragic 12.2% |
| Spanish Americans | 0.6 /100 | #248 | Tragic 12.2% |
| Ute | 0.6 /100 | #249 | Tragic 12.2% |
| Immigrants | Liberia | 0.5 /100 | #250 | Tragic 12.2% |
| Somalis | 0.3 /100 | #251 | Tragic 12.3% |
| Armenians | 0.3 /100 | #252 | Tragic 12.3% |
| Shoshone | 0.3 /100 | #253 | Tragic 12.3% |
| Immigrants | Cambodia | 0.3 /100 | #254 | Tragic 12.4% |
| Mexican American Indians | 0.3 /100 | #255 | Tragic 12.4% |
| Immigrants | Panama | 0.2 /100 | #256 | Tragic 12.4% |
| Immigrants | Immigrants | 0.2 /100 | #257 | Tragic 12.4% |
| Dutch West Indians | 0.2 /100 | #258 | Tragic 12.4% |
| Ghanaians | 0.2 /100 | #259 | Tragic 12.4% |
Demographics Similar to Sri Lankans by Seniors Poverty Over the Age of 65
In terms of seniors poverty over the age of 65, the demographic groups most similar to Sri Lankans are Immigrants from Eastern Europe (10.9%, a difference of 0.090%), Mongolian (10.9%, a difference of 0.10%), Nonimmigrants (10.9%, a difference of 0.16%), Immigrants from Syria (10.9%, a difference of 0.19%), and Alaska Native (10.8%, a difference of 0.32%).
| Demographics | Rating | Rank | Seniors Poverty Over the Age of 65 |
| Immigrants | Indonesia | 64.8 /100 | #162 | Good 10.8% |
| Tsimshian | 64.5 /100 | #163 | Good 10.8% |
| Potawatomi | 62.6 /100 | #164 | Good 10.8% |
| Immigrants | South Eastern Asia | 62.1 /100 | #165 | Good 10.8% |
| Malaysians | 62.0 /100 | #166 | Good 10.8% |
| Alaska Natives | 60.3 /100 | #167 | Good 10.8% |
| Mongolians | 58.0 /100 | #168 | Average 10.9% |
| Sri Lankans | 56.8 /100 | #169 | Average 10.9% |
| Immigrants | Eastern Europe | 55.8 /100 | #170 | Average 10.9% |
| Immigrants | Nonimmigrants | 55.1 /100 | #171 | Average 10.9% |
| Immigrants | Syria | 54.7 /100 | #172 | Average 10.9% |
| Spaniards | 50.7 /100 | #173 | Average 10.9% |
| Immigrants | Sudan | 50.0 /100 | #174 | Average 10.9% |
| Creek | 49.6 /100 | #175 | Average 10.9% |
| Immigrants | Malaysia | 47.9 /100 | #176 | Average 11.0% |