Ottawa vs Immigrants from Argentina Seniors Poverty Over the Age of 65

COMPARE

Ottawa
Race
Ancestry
AfghanAfricanAlaska NativeAlaskan AthabascanAlbanianAleutAlsatianAmericanApacheArabArapahoArgentineanArmenianAssyrian/Chaldean/SyriacAustralianAustrianBahamianBangladeshiBarbadianBasqueBelgianBelizeanBermudanBhutaneseBlackfeetBolivianBrazilianBritishBritish West IndianBulgarianBurmeseCajunCambodianCanadianCape VerdeanCarpatho RusynCelticCentral AmericanCentral American IndianCherokeeCheyenneChickasawChileanChineseChippewaChoctawColombianColvilleComancheCosta RicanCreeCreekCroatianCrowCubanCypriotCzechCzechoslovakianDanishDelawareDominicanDutchDutch West IndianEastern EuropeanEcuadorianEgyptianEnglishEstonianEthiopianEuropeanFijianFilipinoFinnishFrenchFrench American IndianFrench CanadianGermanGerman RussianGhanaianGreekGuamanian/ChamorroGuatemalanGuyaneseHaitianHmongHonduranHopiHoumaHungarianIcelanderIndian (Asian)IndonesianInupiatIranianIraqiIrishIroquoisIsraeliItalianJamaicanJapaneseJordanianKenyanKiowaKoreanLaotianLatvianLebaneseLiberianLithuanianLumbeeLuxembourgerMacedonianMalaysianMalteseMarshalleseMenomineeMexicanMexican American IndianMongolianMoroccanNative HawaiianNavajoNepaleseNew ZealanderNicaraguanNigerianNorthern EuropeanNorwegianOkinawanOsageOttawaPaiutePakistaniPalestinianPanamanianParaguayanPennsylvania GermanPeruvianPimaPolishPortuguesePotawatomiPuebloPuerto RicanPuget Sound SalishRomanianRussianSalvadoranSamoanScandinavianScotch-IrishScottishSeminoleSenegaleseSerbianShoshoneSierra LeoneanSiouxSlavicSlovakSloveneSomaliSouth AfricanSouth AmericanSouth American IndianSoviet UnionSpaniardSpanishSpanish AmericanSpanish American IndianSri LankanSubsaharan AfricanSudaneseSwedishSwissSyrianTaiwaneseThaiTlingit-HaidaTohono O'OdhamTonganTrinidadian and TobagonianTsimshianTurkishU.S. Virgin IslanderUgandanUkrainianUruguayanUteVenezuelanVietnameseWelshWest IndianYakamaYaquiYugoslavianYumanYup'ikZimbabwean
Immigration
NonimmigrantsImmigrantsAfghanistanAfricaAlbaniaArmeniaAsiaAustraliaAustriaBahamasBangladeshBarbadosBelarusBelgiumBelizeBoliviaBosnia and HerzegovinaBrazilBulgariaBurma/MyanmarCabo VerdeCambodiaCameroonCanadaCaribbeanCentral AmericaChileChinaColombiaCongoCosta RicaCroatiaCubaCzechoslovakiaDenmarkDominicaDominican RepublicEastern AfricaEastern AsiaEastern EuropeEcuadorEgyptEl SalvadorEnglandEritreaEthiopiaEuropeFijiFranceGermanyGhanaGreeceGrenadaGuatemalaGuyanaHaitiHondurasHong KongHungaryIndiaIndonesiaIranIraqIrelandIsraelItalyJamaicaJapanJordanKazakhstanKenyaKoreaKuwaitLaosLatin AmericaLatviaLebanonLiberiaLithuaniaMalaysiaMexicoMicronesiaMiddle AfricaMoldovaMoroccoNepalNetherlandsNicaraguaNigeriaNorth AmericaNorth MacedoniaNorthern AfricaNorthern EuropeNorwayOceaniaPakistanPanamaPeruPhilippinesPolandPortugalRomaniaRussiaSaudi ArabiaScotlandSenegalSerbiaSierra LeoneSingaporeSomaliaSouth AfricaSouth AmericaSouth Central AsiaSouth Eastern AsiaSouthern EuropeSpainSri LankaSt. Vincent and the GrenadinesSudanSwedenSwitzerlandSyriaTaiwanThailandTrinidad and TobagoTurkeyUgandaUkraineUruguayUzbekistanVenezuelaVietnamWest IndiesWestern AfricaWestern AsiaWestern EuropeYemenZaireZimbabweAzores
Immigrants from Argentina
Race
Ancestry
AfghanAfricanAlaska NativeAlaskan AthabascanAlbanianAleutAlsatianAmericanApacheArabArapahoArgentineanArmenianAssyrian/Chaldean/SyriacAustralianAustrianBahamianBangladeshiBarbadianBasqueBelgianBelizeanBermudanBhutaneseBlackfeetBolivianBrazilianBritishBritish West IndianBulgarianBurmeseCajunCambodianCanadianCape VerdeanCarpatho RusynCelticCentral AmericanCentral American IndianCherokeeCheyenneChickasawChileanChineseChippewaChoctawColombianColvilleComancheCosta RicanCreeCreekCroatianCrowCubanCypriotCzechCzechoslovakianDanishDelawareDominicanDutchDutch West IndianEastern EuropeanEcuadorianEgyptianEnglishEstonianEthiopianEuropeanFijianFilipinoFinnishFrenchFrench American IndianFrench CanadianGermanGerman RussianGhanaianGreekGuamanian/ChamorroGuatemalanGuyaneseHaitianHmongHonduranHopiHoumaHungarianIcelanderIndian (Asian)IndonesianInupiatIranianIraqiIrishIroquoisIsraeliItalianJamaicanJapaneseJordanianKenyanKiowaKoreanLaotianLatvianLebaneseLiberianLithuanianLumbeeLuxembourgerMacedonianMalaysianMalteseMarshalleseMenomineeMexicanMexican American IndianMongolianMoroccanNative HawaiianNavajoNepaleseNew ZealanderNicaraguanNigerianNorthern EuropeanNorwegianOkinawanOsagePaiutePakistaniPalestinianPanamanianParaguayanPennsylvania GermanPeruvianPimaPolishPortuguesePotawatomiPuebloPuerto RicanPuget Sound SalishRomanianRussianSalvadoranSamoanScandinavianScotch-IrishScottishSeminoleSenegaleseSerbianShoshoneSierra LeoneanSiouxSlavicSlovakSloveneSomaliSouth AfricanSouth AmericanSouth American IndianSoviet UnionSpaniardSpanishSpanish AmericanSpanish American IndianSri LankanSubsaharan AfricanSudaneseSwedishSwissSyrianTaiwaneseThaiTlingit-HaidaTohono O'OdhamTonganTrinidadian and TobagonianTsimshianTurkishU.S. Virgin IslanderUgandanUkrainianUruguayanUteVenezuelanVietnameseWelshWest IndianYakamaYaquiYugoslavianYumanYup'ikZimbabwean
Immigration
NonimmigrantsImmigrantsAfghanistanAfricaAlbaniaArgentinaArmeniaAsiaAustraliaAustriaBahamasBangladeshBarbadosBelarusBelgiumBelizeBoliviaBosnia and HerzegovinaBrazilBulgariaBurma/MyanmarCabo VerdeCambodiaCameroonCanadaCaribbeanCentral AmericaChileChinaColombiaCongoCosta RicaCroatiaCubaCzechoslovakiaDenmarkDominicaDominican RepublicEastern AfricaEastern AsiaEastern EuropeEcuadorEgyptEl SalvadorEnglandEritreaEthiopiaEuropeFijiFranceGermanyGhanaGreeceGrenadaGuatemalaGuyanaHaitiHondurasHong KongHungaryIndiaIndonesiaIranIraqIrelandIsraelItalyJamaicaJapanJordanKazakhstanKenyaKoreaKuwaitLaosLatin AmericaLatviaLebanonLiberiaLithuaniaMalaysiaMexicoMicronesiaMiddle AfricaMoldovaMoroccoNepalNetherlandsNicaraguaNigeriaNorth AmericaNorth MacedoniaNorthern AfricaNorthern EuropeNorwayOceaniaPakistanPanamaPeruPhilippinesPolandPortugalRomaniaRussiaSaudi ArabiaScotlandSenegalSerbiaSierra LeoneSingaporeSomaliaSouth AfricaSouth AmericaSouth Central AsiaSouth Eastern AsiaSouthern EuropeSpainSri LankaSt. Vincent and the GrenadinesSudanSwedenSwitzerlandSyriaTaiwanThailandTrinidad and TobagoTurkeyUgandaUkraineUruguayUzbekistanVenezuelaVietnamWest IndiesWestern AfricaWestern AsiaWestern EuropeYemenZaireZimbabweAzores
Seniors Poverty Over the Age of 65
Income
Poverty
Unemployment
Labor Participation
Family Structure
Vehicle Availability
Education Level
Disability

Seniors Poverty Over the Age of 65 Comparison

Ottawa

Immigrants from Argentina

Excellent
Tragic
10.4%
SENIORS POVERTY OVER THE AGE OF 65
88.5/ 100
METRIC RATING
128th/ 347
METRIC RANK
12.0%
SENIORS POVERTY OVER THE AGE OF 65
1.3/ 100
METRIC RATING
235th/ 347
METRIC RANK

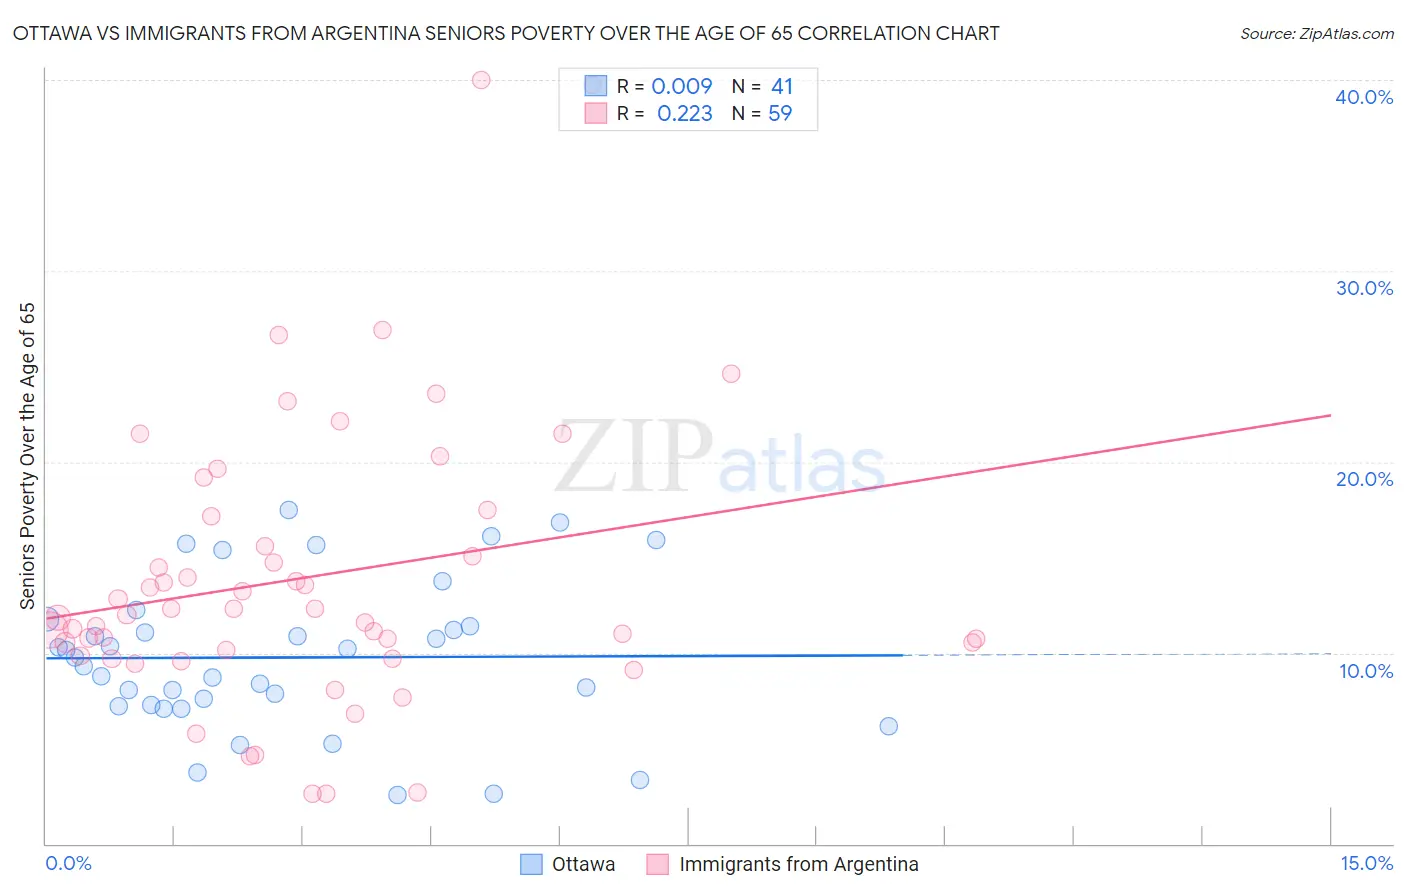
Ottawa vs Immigrants from Argentina Seniors Poverty Over the Age of 65 Correlation Chart

The statistical analysis conducted on geographies consisting of 49,903,467 people shows no correlation between the proportion of Ottawa and poverty level among seniors over the age of 65 in the United States with a correlation coefficient (R) of 0.009 and weighted average of 10.4%. Similarly, the statistical analysis conducted on geographies consisting of 263,959,531 people shows a weak positive correlation between the proportion of Immigrants from Argentina and poverty level among seniors over the age of 65 in the United States with a correlation coefficient (R) of 0.223 and weighted average of 12.0%, a difference of 14.7%.
Ottawa vs Immigrants from Argentina Seniors Poverty Over the Age of 65

Seniors Poverty Over the Age of 65 Correlation Summary

MeasurementOttawaImmigrants from Argentina
Minimum2.6%2.6%
Maximum17.5%40.0%
Range14.9%37.4%
Mean9.8%14.0%
Median9.8%12.0%
Interquartile 25% (IQ1)7.2%9.8%
Interquartile 75% (IQ3)11.6%17.2%
Interquartile Range (IQR)4.3%7.3%
Standard Deviation (Sample)3.9%7.5%
Standard Deviation (Population)3.9%7.5%

Similar Demographics by Seniors Poverty Over the Age of 65

Demographics Similar to Ottawa by Seniors Poverty Over the Age of 65

In terms of seniors poverty over the age of 65, the demographic groups most similar to Ottawa are Immigrants from Iran (10.4%, a difference of 0.020%), Immigrants from Oceania (10.4%, a difference of 0.020%), Immigrants from Hungary (10.4%, a difference of 0.13%), Cambodian (10.4%, a difference of 0.13%), and Egyptian (10.5%, a difference of 0.17%).
DemographicsRating | RankSeniors Poverty Over the Age of 65
Immigrants | Iraq
90.7
/100
|
#121
Exceptional
10.4%
Immigrants | Moldova
90.7
/100
|
#122
Exceptional
10.4%
Hmong
90.0
/100
|
#123
Exceptional
10.4%
Asians
89.9
/100
|
#124
Excellent
10.4%
Immigrants | Philippines
89.4
/100
|
#125
Excellent
10.4%
Immigrants | Hungary
89.1
/100
|
#126
Excellent
10.4%
Cambodians
89.1
/100
|
#127
Excellent
10.4%
Ottawa
88.5
/100
|
#128
Excellent
10.4%
Immigrants | Iran
88.4
/100
|
#129
Excellent
10.4%
Immigrants | Oceania
88.4
/100
|
#130
Excellent
10.4%
Egyptians
87.8
/100
|
#131
Excellent
10.5%
Immigrants | Turkey
87.7
/100
|
#132
Excellent
10.5%
Guamanians/Chamorros
87.5
/100
|
#133
Excellent
10.5%
Sierra Leoneans
86.8
/100
|
#134
Excellent
10.5%
Immigrants | Norway
86.5
/100
|
#135
Excellent
10.5%

Demographics Similar to Immigrants from Argentina by Seniors Poverty Over the Age of 65

In terms of seniors poverty over the age of 65, the demographic groups most similar to Immigrants from Argentina are Immigrants from Peru (12.0%, a difference of 0.030%), Moroccan (12.0%, a difference of 0.18%), Seminole (12.0%, a difference of 0.40%), Iroquois (11.9%, a difference of 0.50%), and Panamanian (11.9%, a difference of 0.59%).
DemographicsRating | RankSeniors Poverty Over the Age of 65
Immigrants | Costa Rica
2.7
/100
|
#228
Tragic
11.8%
Immigrants | Eritrea
2.6
/100
|
#229
Tragic
11.8%
Bermudans
2.1
/100
|
#230
Tragic
11.9%
Cajuns
2.0
/100
|
#231
Tragic
11.9%
Yaqui
1.9
/100
|
#232
Tragic
11.9%
Panamanians
1.8
/100
|
#233
Tragic
11.9%
Iroquois
1.7
/100
|
#234
Tragic
11.9%
Immigrants | Argentina
1.3
/100
|
#235
Tragic
12.0%
Immigrants | Peru
1.3
/100
|
#236
Tragic
12.0%
Moroccans
1.2
/100
|
#237
Tragic
12.0%
Seminole
1.1
/100
|
#238
Tragic
12.0%
Immigrants | Spain
1.0
/100
|
#239
Tragic
12.1%
Comanche
0.9
/100
|
#240
Tragic
12.1%
Immigrants | Albania
0.9
/100
|
#241
Tragic
12.1%
Sub-Saharan Africans
0.9
/100
|
#242
Tragic
12.1%