Sierra Leonean vs Immigrants from Argentina Seniors Poverty Over the Age of 65
COMPARE
Sierra Leonean
Immigrants from Argentina
Seniors Poverty Over the Age of 65
Seniors Poverty Over the Age of 65 Comparison
Sierra Leoneans
Immigrants from Argentina
10.5%
SENIORS POVERTY OVER THE AGE OF 65
86.8/ 100
METRIC RATING
134th/ 347
METRIC RANK
12.0%
SENIORS POVERTY OVER THE AGE OF 65
1.3/ 100
METRIC RATING
235th/ 347
METRIC RANK
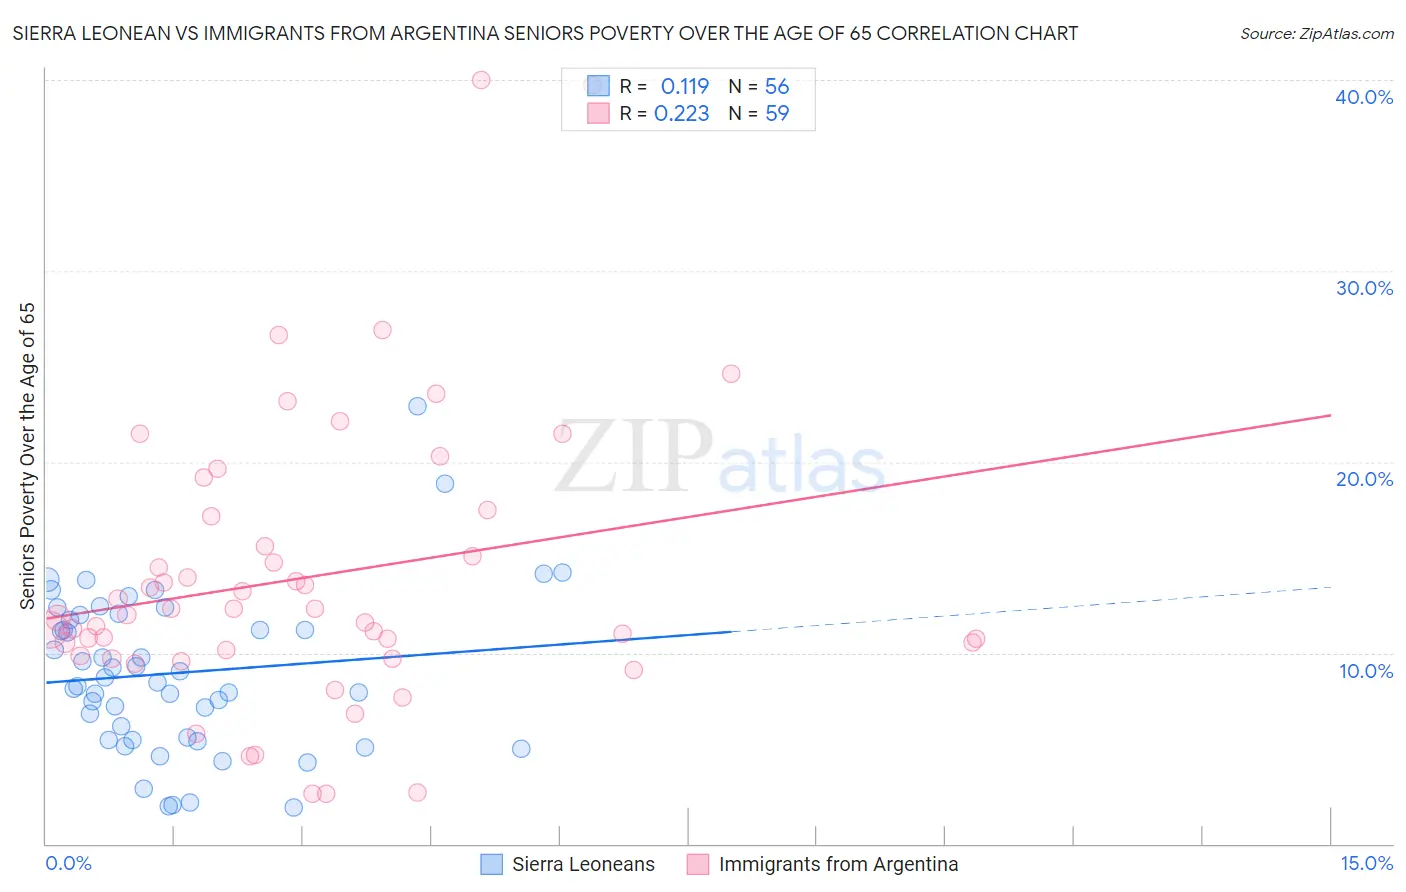
Sierra Leonean vs Immigrants from Argentina Seniors Poverty Over the Age of 65 Correlation Chart
The statistical analysis conducted on geographies consisting of 83,269,460 people shows a poor positive correlation between the proportion of Sierra Leoneans and poverty level among seniors over the age of 65 in the United States with a correlation coefficient (R) of 0.119 and weighted average of 10.5%. Similarly, the statistical analysis conducted on geographies consisting of 263,959,531 people shows a weak positive correlation between the proportion of Immigrants from Argentina and poverty level among seniors over the age of 65 in the United States with a correlation coefficient (R) of 0.223 and weighted average of 12.0%, a difference of 14.3%.
Seniors Poverty Over the Age of 65 Correlation Summary
| Measurement | Sierra Leonean | Immigrants from Argentina |
| Minimum | 1.9% | 2.6% |
| Maximum | 22.9% | 40.0% |
| Range | 21.0% | 37.4% |
| Mean | 9.0% | 14.0% |
| Median | 8.6% | 12.0% |
| Interquartile 25% (IQ1) | 5.5% | 9.8% |
| Interquartile 75% (IQ3) | 11.9% | 17.2% |
| Interquartile Range (IQR) | 6.3% | 7.3% |
| Standard Deviation (Sample) | 4.2% | 7.5% |
| Standard Deviation (Population) | 4.1% | 7.5% |
Similar Demographics by Seniors Poverty Over the Age of 65
Demographics Similar to Sierra Leoneans by Seniors Poverty Over the Age of 65
In terms of seniors poverty over the age of 65, the demographic groups most similar to Sierra Leoneans are Immigrants from Norway (10.5%, a difference of 0.060%), Immigrants from Serbia (10.5%, a difference of 0.070%), Guamanian/Chamorro (10.5%, a difference of 0.15%), Immigrants from Turkey (10.5%, a difference of 0.19%), and Egyptian (10.5%, a difference of 0.20%).
| Demographics | Rating | Rank | Seniors Poverty Over the Age of 65 |
| Cambodians | 89.1 /100 | #127 | Excellent 10.4% |
| Ottawa | 88.5 /100 | #128 | Excellent 10.4% |
| Immigrants | Iran | 88.4 /100 | #129 | Excellent 10.4% |
| Immigrants | Oceania | 88.4 /100 | #130 | Excellent 10.4% |
| Egyptians | 87.8 /100 | #131 | Excellent 10.5% |
| Immigrants | Turkey | 87.7 /100 | #132 | Excellent 10.5% |
| Guamanians/Chamorros | 87.5 /100 | #133 | Excellent 10.5% |
| Sierra Leoneans | 86.8 /100 | #134 | Excellent 10.5% |
| Immigrants | Norway | 86.5 /100 | #135 | Excellent 10.5% |
| Immigrants | Serbia | 86.4 /100 | #136 | Excellent 10.5% |
| Immigrants | Australia | 85.1 /100 | #137 | Excellent 10.5% |
| Immigrants | Latvia | 84.7 /100 | #138 | Excellent 10.5% |
| Portuguese | 84.1 /100 | #139 | Excellent 10.5% |
| Immigrants | Kenya | 83.4 /100 | #140 | Excellent 10.5% |
| Immigrants | Europe | 83.3 /100 | #141 | Excellent 10.5% |
Demographics Similar to Immigrants from Argentina by Seniors Poverty Over the Age of 65
In terms of seniors poverty over the age of 65, the demographic groups most similar to Immigrants from Argentina are Immigrants from Peru (12.0%, a difference of 0.030%), Moroccan (12.0%, a difference of 0.18%), Seminole (12.0%, a difference of 0.40%), Iroquois (11.9%, a difference of 0.50%), and Panamanian (11.9%, a difference of 0.59%).
| Demographics | Rating | Rank | Seniors Poverty Over the Age of 65 |
| Immigrants | Costa Rica | 2.7 /100 | #228 | Tragic 11.8% |
| Immigrants | Eritrea | 2.6 /100 | #229 | Tragic 11.8% |
| Bermudans | 2.1 /100 | #230 | Tragic 11.9% |
| Cajuns | 2.0 /100 | #231 | Tragic 11.9% |
| Yaqui | 1.9 /100 | #232 | Tragic 11.9% |
| Panamanians | 1.8 /100 | #233 | Tragic 11.9% |
| Iroquois | 1.7 /100 | #234 | Tragic 11.9% |
| Immigrants | Argentina | 1.3 /100 | #235 | Tragic 12.0% |
| Immigrants | Peru | 1.3 /100 | #236 | Tragic 12.0% |
| Moroccans | 1.2 /100 | #237 | Tragic 12.0% |
| Seminole | 1.1 /100 | #238 | Tragic 12.0% |
| Immigrants | Spain | 1.0 /100 | #239 | Tragic 12.1% |
| Comanche | 0.9 /100 | #240 | Tragic 12.1% |
| Immigrants | Albania | 0.9 /100 | #241 | Tragic 12.1% |
| Sub-Saharan Africans | 0.9 /100 | #242 | Tragic 12.1% |