Armenian vs Immigrants from Sweden Family Poverty
COMPARE
Armenian
Immigrants from Sweden
Family Poverty
Family Poverty Comparison
Armenians
Immigrants from Sweden
8.5%
FAMILY POVERTY
84.6/ 100
METRIC RATING
138th/ 347
METRIC RANK
7.7%
FAMILY POVERTY
98.8/ 100
METRIC RATING
54th/ 347
METRIC RANK
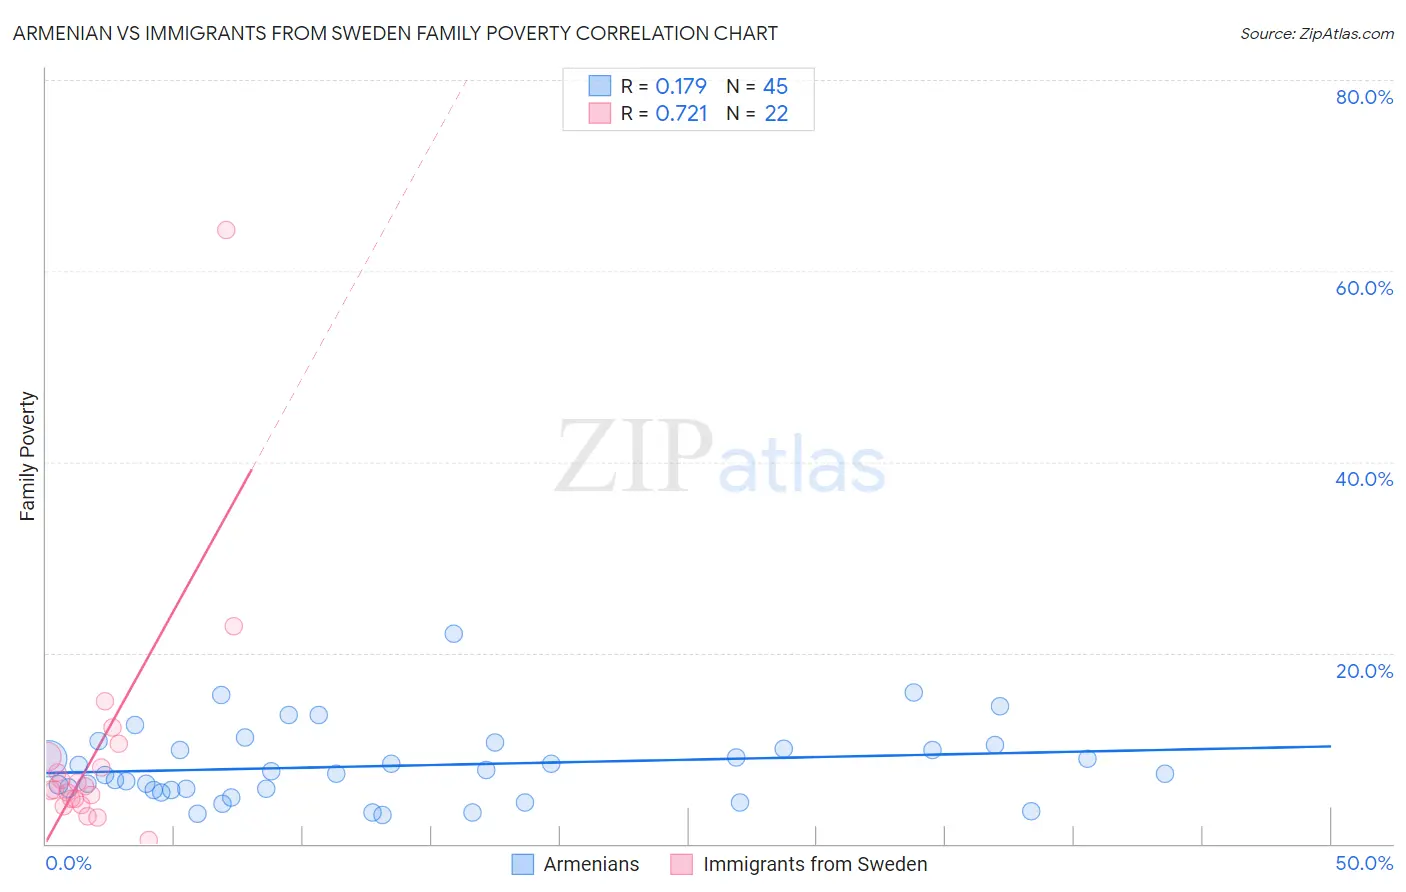
Armenian vs Immigrants from Sweden Family Poverty Correlation Chart
The statistical analysis conducted on geographies consisting of 310,074,733 people shows a poor positive correlation between the proportion of Armenians and poverty level among families in the United States with a correlation coefficient (R) of 0.179 and weighted average of 8.5%. Similarly, the statistical analysis conducted on geographies consisting of 164,497,176 people shows a strong positive correlation between the proportion of Immigrants from Sweden and poverty level among families in the United States with a correlation coefficient (R) of 0.721 and weighted average of 7.7%, a difference of 10.2%.
Family Poverty Correlation Summary
| Measurement | Armenian | Immigrants from Sweden |
| Minimum | 3.0% | 0.43% |
| Maximum | 22.0% | 64.3% |
| Range | 19.0% | 63.9% |
| Mean | 8.2% | 9.7% |
| Median | 7.4% | 5.8% |
| Interquartile 25% (IQ1) | 5.6% | 4.8% |
| Interquartile 75% (IQ3) | 10.1% | 9.1% |
| Interquartile Range (IQR) | 4.5% | 4.4% |
| Standard Deviation (Sample) | 4.0% | 13.1% |
| Standard Deviation (Population) | 3.9% | 12.8% |
Similar Demographics by Family Poverty
Demographics Similar to Armenians by Family Poverty
In terms of family poverty, the demographic groups most similar to Armenians are Immigrants from Nepal (8.5%, a difference of 0.12%), Immigrants from Kazakhstan (8.5%, a difference of 0.15%), Immigrants from Ukraine (8.5%, a difference of 0.18%), Yugoslavian (8.5%, a difference of 0.30%), and Immigrants from Germany (8.5%, a difference of 0.33%).
| Demographics | Rating | Rank | Family Poverty |
| Puget Sound Salish | 88.6 /100 | #131 | Excellent 8.4% |
| Immigrants | Argentina | 88.2 /100 | #132 | Excellent 8.4% |
| Sri Lankans | 86.6 /100 | #133 | Excellent 8.5% |
| Chileans | 86.6 /100 | #134 | Excellent 8.5% |
| Immigrants | Malaysia | 86.5 /100 | #135 | Excellent 8.5% |
| Immigrants | Brazil | 86.3 /100 | #136 | Excellent 8.5% |
| Immigrants | Southern Europe | 86.0 /100 | #137 | Excellent 8.5% |
| Armenians | 84.6 /100 | #138 | Excellent 8.5% |
| Immigrants | Nepal | 84.2 /100 | #139 | Excellent 8.5% |
| Immigrants | Kazakhstan | 84.1 /100 | #140 | Excellent 8.5% |
| Immigrants | Ukraine | 83.9 /100 | #141 | Excellent 8.5% |
| Yugoslavians | 83.5 /100 | #142 | Excellent 8.5% |
| Immigrants | Germany | 83.3 /100 | #143 | Excellent 8.5% |
| Albanians | 83.3 /100 | #144 | Excellent 8.5% |
| Immigrants | South Eastern Asia | 83.2 /100 | #145 | Excellent 8.5% |
Demographics Similar to Immigrants from Sweden by Family Poverty
In terms of family poverty, the demographic groups most similar to Immigrants from Sweden are Swiss (7.7%, a difference of 0.010%), Immigrants from Eastern Asia (7.7%, a difference of 0.030%), Indian (Asian) (7.7%, a difference of 0.070%), Immigrants from Serbia (7.7%, a difference of 0.070%), and Asian (7.7%, a difference of 0.16%).
| Demographics | Rating | Rank | Family Poverty |
| Immigrants | Czechoslovakia | 98.9 /100 | #47 | Exceptional 7.7% |
| Immigrants | Sri Lanka | 98.9 /100 | #48 | Exceptional 7.7% |
| Immigrants | Bolivia | 98.9 /100 | #49 | Exceptional 7.7% |
| Immigrants | North Macedonia | 98.9 /100 | #50 | Exceptional 7.7% |
| Immigrants | Moldova | 98.8 /100 | #51 | Exceptional 7.7% |
| Indians (Asian) | 98.8 /100 | #52 | Exceptional 7.7% |
| Swiss | 98.8 /100 | #53 | Exceptional 7.7% |
| Immigrants | Sweden | 98.8 /100 | #54 | Exceptional 7.7% |
| Immigrants | Eastern Asia | 98.7 /100 | #55 | Exceptional 7.7% |
| Immigrants | Serbia | 98.7 /100 | #56 | Exceptional 7.7% |
| Asians | 98.7 /100 | #57 | Exceptional 7.7% |
| Finns | 98.7 /100 | #58 | Exceptional 7.7% |
| Europeans | 98.7 /100 | #59 | Exceptional 7.7% |
| Immigrants | Greece | 98.7 /100 | #60 | Exceptional 7.7% |
| Immigrants | Netherlands | 98.6 /100 | #61 | Exceptional 7.7% |