Argentinean vs Scotch-Irish Unemployment Among Women with Children Under 6 years
COMPARE
Argentinean
Scotch-Irish
Unemployment Among Women with Children Under 6 years
Unemployment Among Women with Children Under 6 years Comparison
Argentineans
Scotch-Irish
7.2%
UNEMPLOYMENT AMONG WOMEN WITH CHILDREN UNDER 6 YEARS
96.2/ 100
METRIC RATING
114th/ 347
METRIC RANK
8.4%
UNEMPLOYMENT AMONG WOMEN WITH CHILDREN UNDER 6 YEARS
0.3/ 100
METRIC RATING
263rd/ 347
METRIC RANK
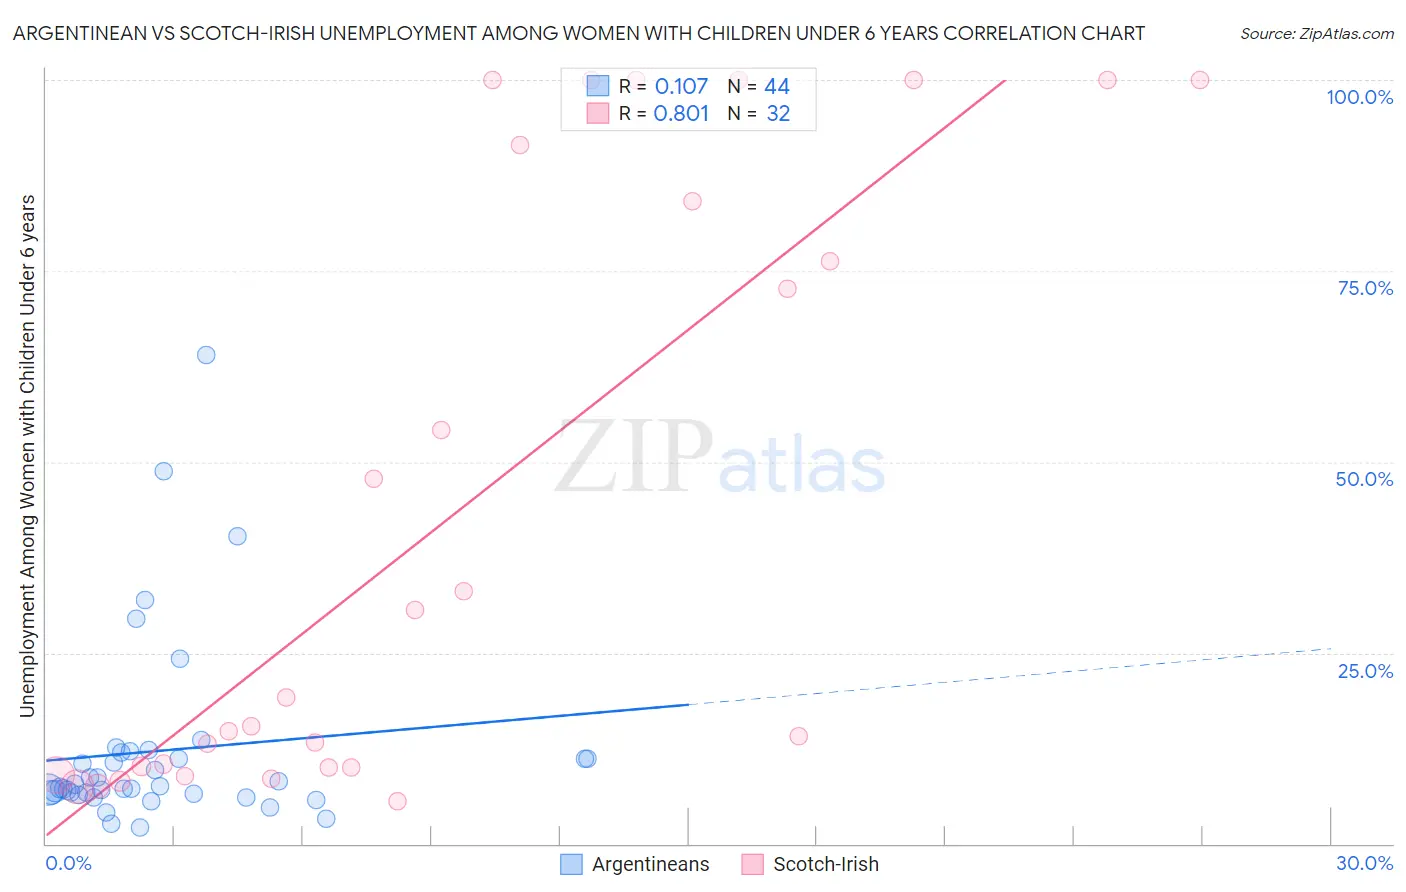
Argentinean vs Scotch-Irish Unemployment Among Women with Children Under 6 years Correlation Chart
The statistical analysis conducted on geographies consisting of 240,769,726 people shows a poor positive correlation between the proportion of Argentineans and unemployment rate among women with children under the age of 6 in the United States with a correlation coefficient (R) of 0.107 and weighted average of 7.2%. Similarly, the statistical analysis conducted on geographies consisting of 365,350,902 people shows a very strong positive correlation between the proportion of Scotch-Irish and unemployment rate among women with children under the age of 6 in the United States with a correlation coefficient (R) of 0.801 and weighted average of 8.4%, a difference of 16.0%.
Unemployment Among Women with Children Under 6 years Correlation Summary
| Measurement | Argentinean | Scotch-Irish |
| Minimum | 2.2% | 5.6% |
| Maximum | 64.0% | 100.0% |
| Range | 61.8% | 94.4% |
| Mean | 12.2% | 43.0% |
| Median | 7.4% | 17.2% |
| Interquartile 25% (IQ1) | 6.6% | 10.0% |
| Interquartile 75% (IQ3) | 11.6% | 87.8% |
| Interquartile Range (IQR) | 5.0% | 77.9% |
| Standard Deviation (Sample) | 12.4% | 38.9% |
| Standard Deviation (Population) | 12.3% | 38.3% |
Similar Demographics by Unemployment Among Women with Children Under 6 years
Demographics Similar to Argentineans by Unemployment Among Women with Children Under 6 years
In terms of unemployment among women with children under 6 years, the demographic groups most similar to Argentineans are Nicaraguan (7.2%, a difference of 0.040%), Immigrants from Italy (7.2%, a difference of 0.080%), Israeli (7.2%, a difference of 0.12%), Armenian (7.2%, a difference of 0.17%), and Norwegian (7.2%, a difference of 0.23%).
| Demographics | Rating | Rank | Unemployment Among Women with Children Under 6 years |
| Immigrants | Kazakhstan | 97.1 /100 | #107 | Exceptional 7.2% |
| Eastern Europeans | 96.9 /100 | #108 | Exceptional 7.2% |
| Australians | 96.9 /100 | #109 | Exceptional 7.2% |
| Palestinians | 96.8 /100 | #110 | Exceptional 7.2% |
| Norwegians | 96.7 /100 | #111 | Exceptional 7.2% |
| Israelis | 96.5 /100 | #112 | Exceptional 7.2% |
| Nicaraguans | 96.3 /100 | #113 | Exceptional 7.2% |
| Argentineans | 96.2 /100 | #114 | Exceptional 7.2% |
| Immigrants | Italy | 96.1 /100 | #115 | Exceptional 7.2% |
| Armenians | 95.9 /100 | #116 | Exceptional 7.2% |
| Immigrants | Kenya | 95.4 /100 | #117 | Exceptional 7.3% |
| Serbians | 94.5 /100 | #118 | Exceptional 7.3% |
| South Africans | 94.1 /100 | #119 | Exceptional 7.3% |
| Iraqis | 93.9 /100 | #120 | Exceptional 7.3% |
| Immigrants | Chile | 93.5 /100 | #121 | Exceptional 7.3% |
Demographics Similar to Scotch-Irish by Unemployment Among Women with Children Under 6 years
In terms of unemployment among women with children under 6 years, the demographic groups most similar to Scotch-Irish are Honduran (8.4%, a difference of 0.020%), West Indian (8.4%, a difference of 0.030%), Immigrants from Liberia (8.4%, a difference of 0.040%), French Canadian (8.4%, a difference of 0.070%), and Immigrants from Honduras (8.4%, a difference of 0.070%).
| Demographics | Rating | Rank | Unemployment Among Women with Children Under 6 years |
| Celtics | 0.6 /100 | #256 | Tragic 8.3% |
| British West Indians | 0.5 /100 | #257 | Tragic 8.3% |
| Immigrants | Ghana | 0.5 /100 | #258 | Tragic 8.3% |
| Barbadians | 0.4 /100 | #259 | Tragic 8.3% |
| Whites/Caucasians | 0.3 /100 | #260 | Tragic 8.4% |
| Immigrants | Liberia | 0.3 /100 | #261 | Tragic 8.4% |
| West Indians | 0.3 /100 | #262 | Tragic 8.4% |
| Scotch-Irish | 0.3 /100 | #263 | Tragic 8.4% |
| Hondurans | 0.3 /100 | #264 | Tragic 8.4% |
| French Canadians | 0.3 /100 | #265 | Tragic 8.4% |
| Immigrants | Honduras | 0.3 /100 | #266 | Tragic 8.4% |
| Belizeans | 0.2 /100 | #267 | Tragic 8.4% |
| Sub-Saharan Africans | 0.2 /100 | #268 | Tragic 8.4% |
| Immigrants | Haiti | 0.2 /100 | #269 | Tragic 8.4% |
| Immigrants | Senegal | 0.2 /100 | #270 | Tragic 8.5% |