Immigrants from Fiji vs Immigrants from Nigeria Single Male Poverty
COMPARE
Immigrants from Fiji
Immigrants from Nigeria
Single Male Poverty
Single Male Poverty Comparison
Immigrants from Fiji
Immigrants from Nigeria
10.9%
SINGLE MALE POVERTY
100.0/ 100
METRIC RATING
10th/ 347
METRIC RANK
12.7%
SINGLE MALE POVERTY
62.8/ 100
METRIC RATING
164th/ 347
METRIC RANK
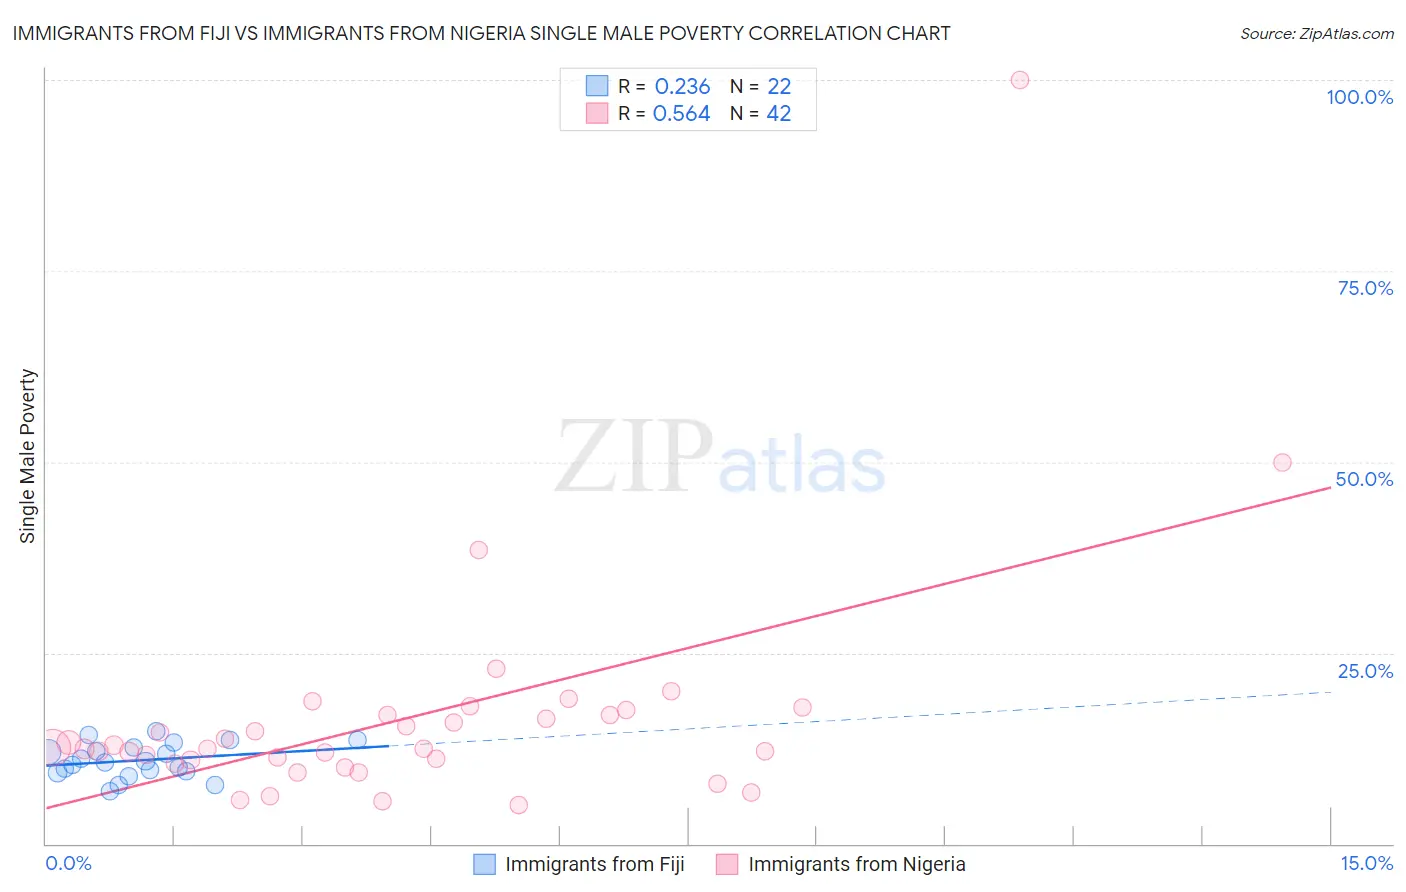
Immigrants from Fiji vs Immigrants from Nigeria Single Male Poverty Correlation Chart
The statistical analysis conducted on geographies consisting of 90,653,076 people shows a weak positive correlation between the proportion of Immigrants from Fiji and poverty level among single males in the United States with a correlation coefficient (R) of 0.236 and weighted average of 10.9%. Similarly, the statistical analysis conducted on geographies consisting of 260,626,555 people shows a substantial positive correlation between the proportion of Immigrants from Nigeria and poverty level among single males in the United States with a correlation coefficient (R) of 0.564 and weighted average of 12.7%, a difference of 16.6%.
Single Male Poverty Correlation Summary
| Measurement | Immigrants from Fiji | Immigrants from Nigeria |
| Minimum | 6.8% | 5.0% |
| Maximum | 14.7% | 100.0% |
| Range | 7.9% | 95.0% |
| Mean | 10.9% | 16.5% |
| Median | 10.7% | 12.5% |
| Interquartile 25% (IQ1) | 9.5% | 10.9% |
| Interquartile 75% (IQ3) | 12.6% | 16.9% |
| Interquartile Range (IQR) | 3.1% | 6.0% |
| Standard Deviation (Sample) | 2.2% | 15.4% |
| Standard Deviation (Population) | 2.2% | 15.2% |
Similar Demographics by Single Male Poverty
Demographics Similar to Immigrants from Fiji by Single Male Poverty
In terms of single male poverty, the demographic groups most similar to Immigrants from Fiji are Immigrants from Philippines (10.9%, a difference of 0.020%), Taiwanese (10.9%, a difference of 0.050%), Immigrants from Afghanistan (10.9%, a difference of 0.090%), Immigrants from South Central Asia (10.9%, a difference of 0.22%), and Chinese (11.0%, a difference of 0.78%).
| Demographics | Rating | Rank | Single Male Poverty |
| Immigrants | India | 100.0 /100 | #3 | Exceptional 10.3% |
| Immigrants | Hong Kong | 100.0 /100 | #4 | Exceptional 10.4% |
| Tongans | 100.0 /100 | #5 | Exceptional 10.5% |
| Filipinos | 100.0 /100 | #6 | Exceptional 10.6% |
| Afghans | 100.0 /100 | #7 | Exceptional 10.7% |
| Thais | 100.0 /100 | #8 | Exceptional 10.8% |
| Taiwanese | 100.0 /100 | #9 | Exceptional 10.9% |
| Immigrants | Fiji | 100.0 /100 | #10 | Exceptional 10.9% |
| Immigrants | Philippines | 100.0 /100 | #11 | Exceptional 10.9% |
| Immigrants | Afghanistan | 100.0 /100 | #12 | Exceptional 10.9% |
| Immigrants | South Central Asia | 100.0 /100 | #13 | Exceptional 10.9% |
| Chinese | 100.0 /100 | #14 | Exceptional 11.0% |
| Koreans | 100.0 /100 | #15 | Exceptional 11.0% |
| Bhutanese | 100.0 /100 | #16 | Exceptional 11.1% |
| Tsimshian | 100.0 /100 | #17 | Exceptional 11.1% |
Demographics Similar to Immigrants from Nigeria by Single Male Poverty
In terms of single male poverty, the demographic groups most similar to Immigrants from Nigeria are Palestinian (12.7%, a difference of 0.010%), Eastern European (12.7%, a difference of 0.020%), Immigrants from Africa (12.7%, a difference of 0.030%), Immigrants from Cambodia (12.7%, a difference of 0.040%), and Greek (12.7%, a difference of 0.070%).
| Demographics | Rating | Rank | Single Male Poverty |
| Latvians | 67.9 /100 | #157 | Good 12.7% |
| Immigrants | Middle Africa | 64.9 /100 | #158 | Good 12.7% |
| Immigrants | Liberia | 64.2 /100 | #159 | Good 12.7% |
| Greeks | 64.1 /100 | #160 | Good 12.7% |
| Immigrants | Africa | 63.4 /100 | #161 | Good 12.7% |
| Eastern Europeans | 63.3 /100 | #162 | Good 12.7% |
| Palestinians | 63.1 /100 | #163 | Good 12.7% |
| Immigrants | Nigeria | 62.8 /100 | #164 | Good 12.7% |
| Immigrants | Cambodia | 62.2 /100 | #165 | Good 12.7% |
| Immigrants | Guyana | 60.5 /100 | #166 | Good 12.7% |
| Immigrants | Sudan | 58.2 /100 | #167 | Average 12.7% |
| Immigrants | Barbados | 57.7 /100 | #168 | Average 12.7% |
| Puget Sound Salish | 54.3 /100 | #169 | Average 12.8% |
| Guyanese | 52.0 /100 | #170 | Average 12.8% |
| South Africans | 51.5 /100 | #171 | Average 12.8% |