Immigrants from Australia vs Spanish American Single Mother Poverty
COMPARE
Immigrants from Australia
Spanish American
Single Mother Poverty
Single Mother Poverty Comparison
Immigrants from Australia
Spanish Americans
27.3%
SINGLE MOTHER POVERTY
99.5/ 100
METRIC RATING
67th/ 347
METRIC RANK
32.3%
SINGLE MOTHER POVERTY
0.0/ 100
METRIC RATING
283rd/ 347
METRIC RANK
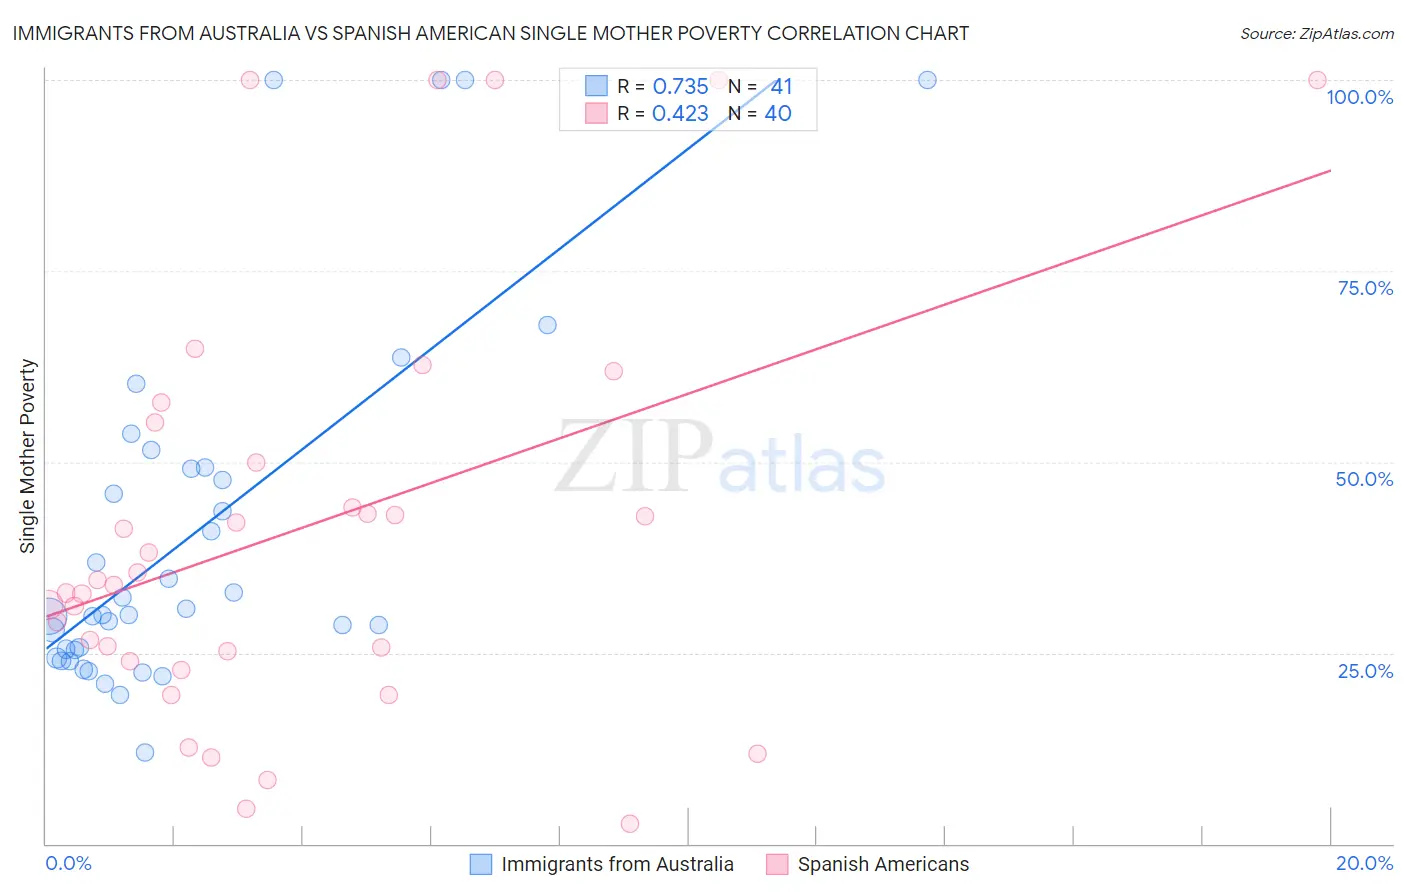
Immigrants from Australia vs Spanish American Single Mother Poverty Correlation Chart
The statistical analysis conducted on geographies consisting of 222,815,185 people shows a strong positive correlation between the proportion of Immigrants from Australia and poverty level among single mothers in the United States with a correlation coefficient (R) of 0.735 and weighted average of 27.3%. Similarly, the statistical analysis conducted on geographies consisting of 102,717,575 people shows a moderate positive correlation between the proportion of Spanish Americans and poverty level among single mothers in the United States with a correlation coefficient (R) of 0.423 and weighted average of 32.3%, a difference of 18.1%.
Single Mother Poverty Correlation Summary
| Measurement | Immigrants from Australia | Spanish American |
| Minimum | 11.9% | 2.6% |
| Maximum | 100.0% | 100.0% |
| Range | 88.1% | 97.4% |
| Mean | 40.6% | 41.2% |
| Median | 30.0% | 34.2% |
| Interquartile 25% (IQ1) | 24.9% | 24.5% |
| Interquartile 75% (IQ3) | 49.2% | 52.6% |
| Interquartile Range (IQR) | 24.3% | 28.0% |
| Standard Deviation (Sample) | 23.5% | 27.2% |
| Standard Deviation (Population) | 23.2% | 26.9% |
Similar Demographics by Single Mother Poverty
Demographics Similar to Immigrants from Australia by Single Mother Poverty
In terms of single mother poverty, the demographic groups most similar to Immigrants from Australia are Soviet Union (27.3%, a difference of 0.020%), Immigrants from Czechoslovakia (27.4%, a difference of 0.030%), Immigrants from Turkey (27.3%, a difference of 0.060%), Russian (27.3%, a difference of 0.14%), and Immigrants from Northern Europe (27.3%, a difference of 0.17%).
| Demographics | Rating | Rank | Single Mother Poverty |
| Eastern Europeans | 99.6 /100 | #60 | Exceptional 27.2% |
| Immigrants | Eastern Europe | 99.6 /100 | #61 | Exceptional 27.2% |
| Immigrants | Malaysia | 99.5 /100 | #62 | Exceptional 27.3% |
| Immigrants | Northern Europe | 99.5 /100 | #63 | Exceptional 27.3% |
| Russians | 99.5 /100 | #64 | Exceptional 27.3% |
| Immigrants | Turkey | 99.5 /100 | #65 | Exceptional 27.3% |
| Soviet Union | 99.5 /100 | #66 | Exceptional 27.3% |
| Immigrants | Australia | 99.5 /100 | #67 | Exceptional 27.3% |
| Immigrants | Czechoslovakia | 99.5 /100 | #68 | Exceptional 27.4% |
| Lithuanians | 99.4 /100 | #69 | Exceptional 27.4% |
| Immigrants | Belarus | 99.4 /100 | #70 | Exceptional 27.4% |
| Macedonians | 99.4 /100 | #71 | Exceptional 27.4% |
| Immigrants | Russia | 99.4 /100 | #72 | Exceptional 27.4% |
| Sierra Leoneans | 99.3 /100 | #73 | Exceptional 27.4% |
| Immigrants | Europe | 99.3 /100 | #74 | Exceptional 27.4% |
Demographics Similar to Spanish Americans by Single Mother Poverty
In terms of single mother poverty, the demographic groups most similar to Spanish Americans are Immigrants from the Azores (32.2%, a difference of 0.25%), Indonesian (32.4%, a difference of 0.30%), Cree (32.2%, a difference of 0.36%), Nonimmigrants (32.2%, a difference of 0.39%), and Immigrants from Latin America (32.4%, a difference of 0.41%).
| Demographics | Rating | Rank | Single Mother Poverty |
| Delaware | 0.0 /100 | #276 | Tragic 31.8% |
| Mexican American Indians | 0.0 /100 | #277 | Tragic 31.9% |
| Immigrants | Zaire | 0.0 /100 | #278 | Tragic 32.0% |
| Marshallese | 0.0 /100 | #279 | Tragic 32.1% |
| Immigrants | Nonimmigrants | 0.0 /100 | #280 | Tragic 32.2% |
| Cree | 0.0 /100 | #281 | Tragic 32.2% |
| Immigrants | Azores | 0.0 /100 | #282 | Tragic 32.2% |
| Spanish Americans | 0.0 /100 | #283 | Tragic 32.3% |
| Indonesians | 0.0 /100 | #284 | Tragic 32.4% |
| Immigrants | Latin America | 0.0 /100 | #285 | Tragic 32.4% |
| Yup'ik | 0.0 /100 | #286 | Tragic 32.5% |
| Immigrants | Dominica | 0.0 /100 | #287 | Tragic 32.5% |
| Somalis | 0.0 /100 | #288 | Tragic 32.6% |
| U.S. Virgin Islanders | 0.0 /100 | #289 | Tragic 32.6% |
| Osage | 0.0 /100 | #290 | Tragic 32.6% |