Apache vs Immigrants from Europe Cognitive Disability
COMPARE
Apache
Immigrants from Europe
Cognitive Disability
Cognitive Disability Comparison
Apache
Immigrants from Europe
18.6%
COGNITIVE DISABILITY
0.0/ 100
METRIC RATING
320th/ 347
METRIC RANK
16.5%
COGNITIVE DISABILITY
99.8/ 100
METRIC RATING
45th/ 347
METRIC RANK
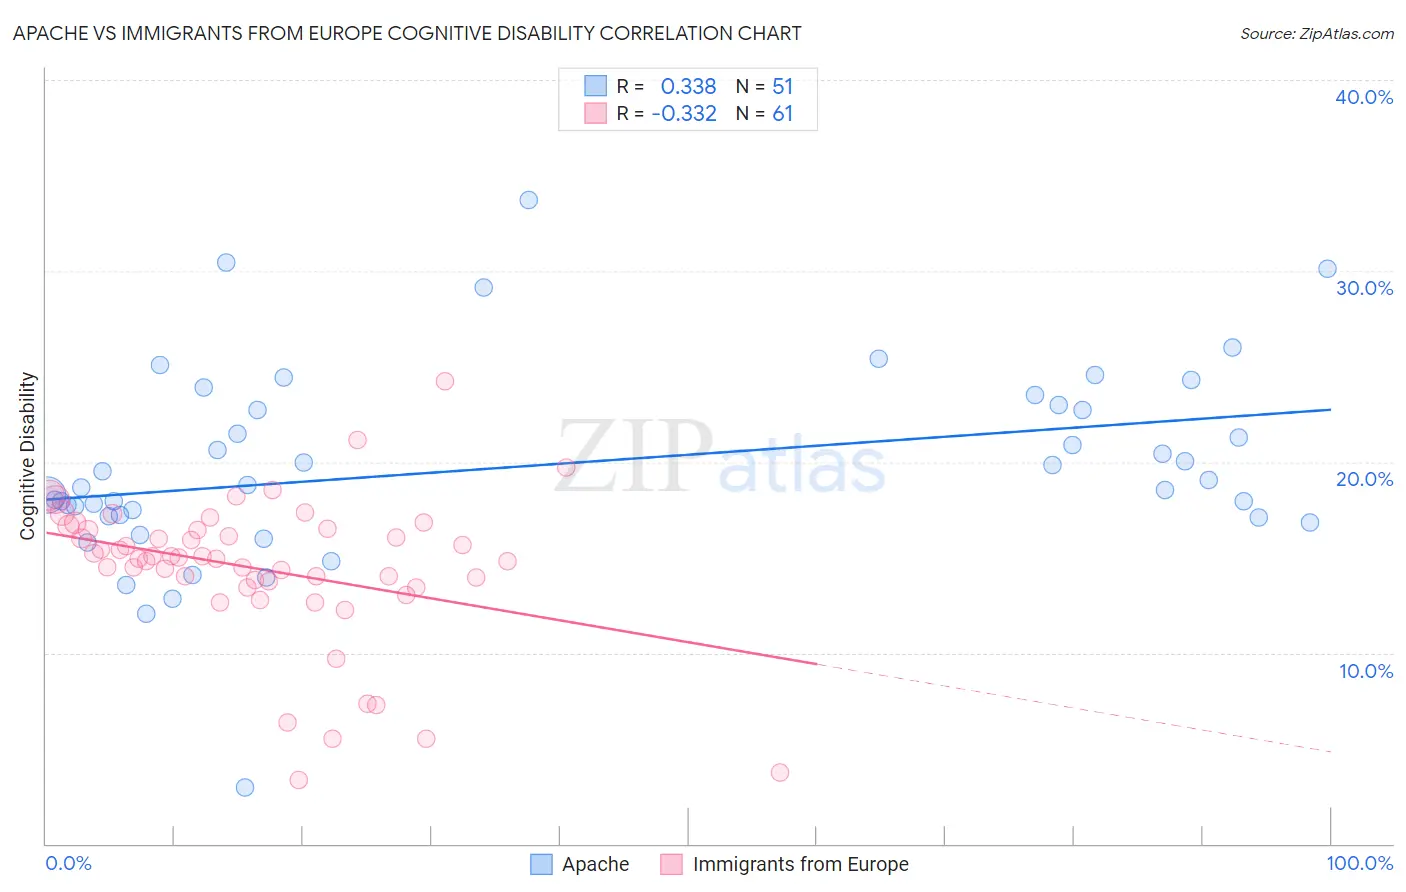
Apache vs Immigrants from Europe Cognitive Disability Correlation Chart
The statistical analysis conducted on geographies consisting of 231,073,406 people shows a mild positive correlation between the proportion of Apache and percentage of population with cognitive disability in the United States with a correlation coefficient (R) of 0.338 and weighted average of 18.6%. Similarly, the statistical analysis conducted on geographies consisting of 547,313,932 people shows a mild negative correlation between the proportion of Immigrants from Europe and percentage of population with cognitive disability in the United States with a correlation coefficient (R) of -0.332 and weighted average of 16.5%, a difference of 13.0%.
Cognitive Disability Correlation Summary
| Measurement | Apache | Immigrants from Europe |
| Minimum | 2.9% | 3.3% |
| Maximum | 33.7% | 24.2% |
| Range | 30.8% | 20.9% |
| Mean | 19.8% | 14.4% |
| Median | 18.8% | 15.0% |
| Interquartile 25% (IQ1) | 17.2% | 13.6% |
| Interquartile 75% (IQ3) | 23.0% | 16.5% |
| Interquartile Range (IQR) | 5.8% | 2.9% |
| Standard Deviation (Sample) | 5.2% | 3.9% |
| Standard Deviation (Population) | 5.2% | 3.9% |
Similar Demographics by Cognitive Disability
Demographics Similar to Apache by Cognitive Disability
In terms of cognitive disability, the demographic groups most similar to Apache are Comanche (18.6%, a difference of 0.040%), Bangladeshi (18.6%, a difference of 0.080%), African (18.6%, a difference of 0.090%), Immigrants from Liberia (18.7%, a difference of 0.16%), and Pueblo (18.7%, a difference of 0.17%).
| Demographics | Rating | Rank | Cognitive Disability |
| Yaqui | 0.0 /100 | #313 | Tragic 18.5% |
| Sub-Saharan Africans | 0.0 /100 | #314 | Tragic 18.5% |
| Immigrants | Dominica | 0.0 /100 | #315 | Tragic 18.6% |
| Immigrants | Middle Africa | 0.0 /100 | #316 | Tragic 18.6% |
| Liberians | 0.0 /100 | #317 | Tragic 18.6% |
| Bangladeshis | 0.0 /100 | #318 | Tragic 18.6% |
| Comanche | 0.0 /100 | #319 | Tragic 18.6% |
| Apache | 0.0 /100 | #320 | Tragic 18.6% |
| Africans | 0.0 /100 | #321 | Tragic 18.6% |
| Immigrants | Liberia | 0.0 /100 | #322 | Tragic 18.7% |
| Pueblo | 0.0 /100 | #323 | Tragic 18.7% |
| Dominicans | 0.0 /100 | #324 | Tragic 18.7% |
| Indonesians | 0.0 /100 | #325 | Tragic 18.7% |
| Immigrants | Senegal | 0.0 /100 | #326 | Tragic 18.7% |
| U.S. Virgin Islanders | 0.0 /100 | #327 | Tragic 18.7% |
Demographics Similar to Immigrants from Europe by Cognitive Disability
In terms of cognitive disability, the demographic groups most similar to Immigrants from Europe are Macedonian (16.5%, a difference of 0.010%), Immigrants from Colombia (16.5%, a difference of 0.010%), Immigrants from Canada (16.5%, a difference of 0.030%), Immigrants from Italy (16.5%, a difference of 0.040%), and Immigrants from North America (16.5%, a difference of 0.040%).
| Demographics | Rating | Rank | Cognitive Disability |
| Immigrants | Eastern Europe | 99.9 /100 | #38 | Exceptional 16.5% |
| Bolivians | 99.9 /100 | #39 | Exceptional 16.5% |
| Immigrants | Belarus | 99.9 /100 | #40 | Exceptional 16.5% |
| Cubans | 99.9 /100 | #41 | Exceptional 16.5% |
| Hungarians | 99.9 /100 | #42 | Exceptional 16.5% |
| Immigrants | Canada | 99.8 /100 | #43 | Exceptional 16.5% |
| Macedonians | 99.8 /100 | #44 | Exceptional 16.5% |
| Immigrants | Europe | 99.8 /100 | #45 | Exceptional 16.5% |
| Immigrants | Colombia | 99.8 /100 | #46 | Exceptional 16.5% |
| Immigrants | Italy | 99.8 /100 | #47 | Exceptional 16.5% |
| Immigrants | North America | 99.8 /100 | #48 | Exceptional 16.5% |
| Iranians | 99.8 /100 | #49 | Exceptional 16.5% |
| Norwegians | 99.8 /100 | #50 | Exceptional 16.5% |
| Immigrants | Korea | 99.8 /100 | #51 | Exceptional 16.5% |
| Soviet Union | 99.8 /100 | #52 | Exceptional 16.5% |