Immigrants from Uganda vs Bolivian Single Father Poverty
COMPARE
Immigrants from Uganda
Bolivian
Single Father Poverty
Single Father Poverty Comparison
Immigrants from Uganda
Bolivians
16.7%
SINGLE FATHER POVERTY
8.6/ 100
METRIC RATING
218th/ 347
METRIC RANK
14.7%
SINGLE FATHER POVERTY
100.0/ 100
METRIC RATING
38th/ 347
METRIC RANK
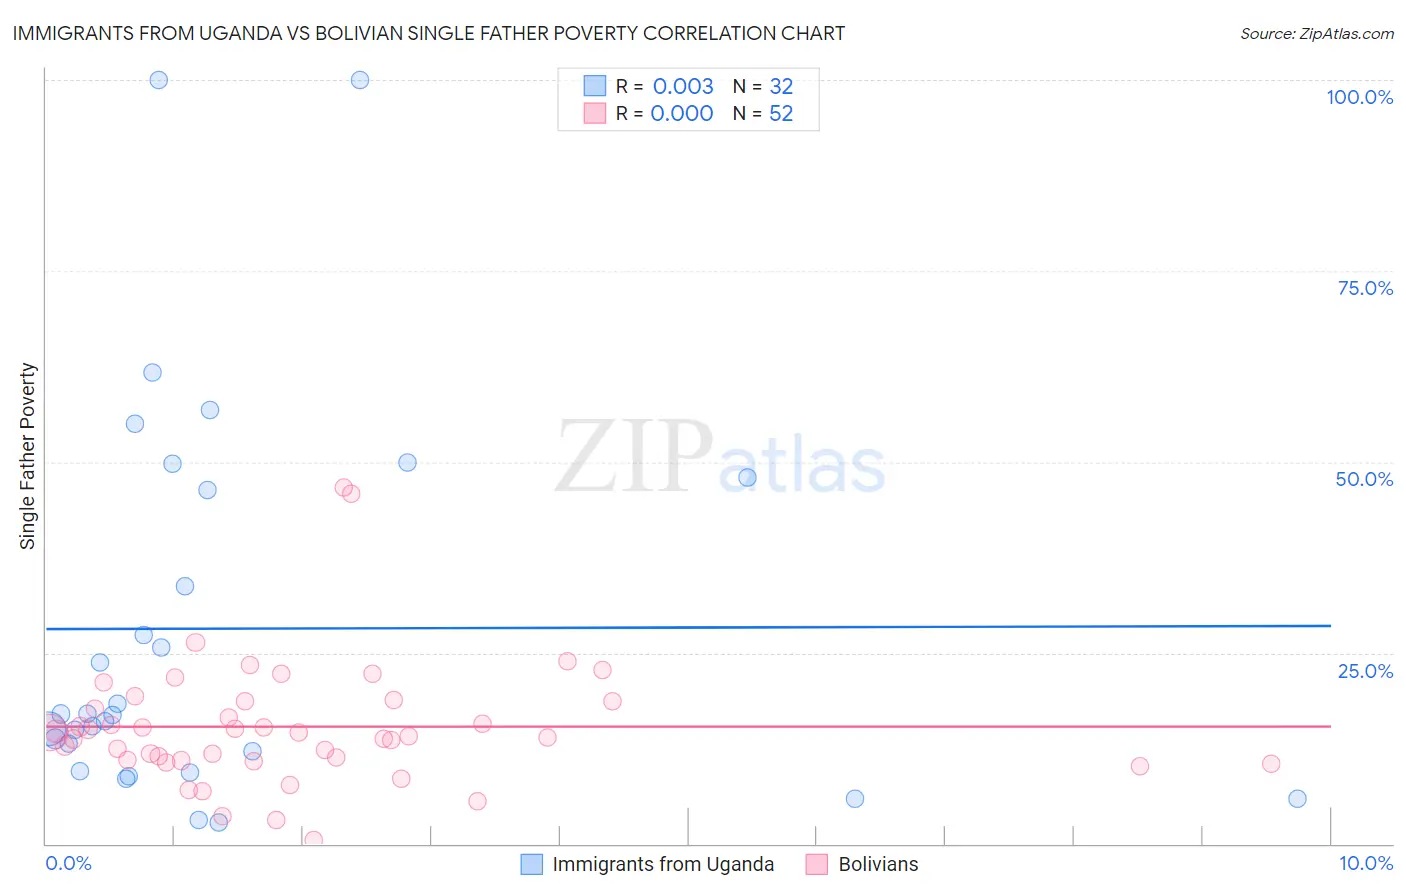
Immigrants from Uganda vs Bolivian Single Father Poverty Correlation Chart
The statistical analysis conducted on geographies consisting of 112,192,123 people shows no correlation between the proportion of Immigrants from Uganda and poverty level among single fathers in the United States with a correlation coefficient (R) of 0.003 and weighted average of 16.7%. Similarly, the statistical analysis conducted on geographies consisting of 157,877,648 people shows no correlation between the proportion of Bolivians and poverty level among single fathers in the United States with a correlation coefficient (R) of 0.000 and weighted average of 14.7%, a difference of 13.7%.
Single Father Poverty Correlation Summary
| Measurement | Immigrants from Uganda | Bolivian |
| Minimum | 2.8% | 0.47% |
| Maximum | 100.0% | 46.7% |
| Range | 97.2% | 46.2% |
| Mean | 28.2% | 15.3% |
| Median | 16.9% | 14.3% |
| Interquartile 25% (IQ1) | 10.8% | 10.9% |
| Interquartile 75% (IQ3) | 47.1% | 18.6% |
| Interquartile Range (IQR) | 36.3% | 7.7% |
| Standard Deviation (Sample) | 25.6% | 8.3% |
| Standard Deviation (Population) | 25.2% | 8.2% |
Similar Demographics by Single Father Poverty
Demographics Similar to Immigrants from Uganda by Single Father Poverty
In terms of single father poverty, the demographic groups most similar to Immigrants from Uganda are Immigrants from Ghana (16.7%, a difference of 0.060%), Immigrants from Denmark (16.7%, a difference of 0.070%), Immigrants from Greece (16.7%, a difference of 0.070%), Immigrants from Spain (16.7%, a difference of 0.070%), and Cheyenne (16.7%, a difference of 0.10%).
| Demographics | Rating | Rank | Single Father Poverty |
| Arabs | 12.8 /100 | #211 | Poor 16.6% |
| Immigrants | Southern Europe | 11.2 /100 | #212 | Poor 16.7% |
| Ghanaians | 11.0 /100 | #213 | Poor 16.7% |
| Spanish | 10.7 /100 | #214 | Poor 16.7% |
| Immigrants | Scotland | 9.6 /100 | #215 | Tragic 16.7% |
| Immigrants | England | 9.5 /100 | #216 | Tragic 16.7% |
| Cheyenne | 9.3 /100 | #217 | Tragic 16.7% |
| Immigrants | Uganda | 8.6 /100 | #218 | Tragic 16.7% |
| Immigrants | Ghana | 8.1 /100 | #219 | Tragic 16.7% |
| Immigrants | Denmark | 8.1 /100 | #220 | Tragic 16.7% |
| Immigrants | Greece | 8.1 /100 | #221 | Tragic 16.7% |
| Immigrants | Spain | 8.0 /100 | #222 | Tragic 16.7% |
| Immigrants | Austria | 7.0 /100 | #223 | Tragic 16.8% |
| Immigrants | Norway | 6.5 /100 | #224 | Tragic 16.8% |
| Menominee | 6.4 /100 | #225 | Tragic 16.8% |
Demographics Similar to Bolivians by Single Father Poverty
In terms of single father poverty, the demographic groups most similar to Bolivians are Immigrants from Eastern Africa (14.7%, a difference of 0.010%), Immigrants from Indonesia (14.7%, a difference of 0.14%), Immigrants from Asia (14.7%, a difference of 0.18%), Immigrants from Bolivia (14.7%, a difference of 0.30%), and Egyptian (14.7%, a difference of 0.37%).
| Demographics | Rating | Rank | Single Father Poverty |
| Icelanders | 100.0 /100 | #31 | Exceptional 14.5% |
| Asians | 100.0 /100 | #32 | Exceptional 14.6% |
| Okinawans | 100.0 /100 | #33 | Exceptional 14.6% |
| Egyptians | 100.0 /100 | #34 | Exceptional 14.7% |
| Immigrants | Bolivia | 100.0 /100 | #35 | Exceptional 14.7% |
| Immigrants | Indonesia | 100.0 /100 | #36 | Exceptional 14.7% |
| Immigrants | Eastern Africa | 100.0 /100 | #37 | Exceptional 14.7% |
| Bolivians | 100.0 /100 | #38 | Exceptional 14.7% |
| Immigrants | Asia | 100.0 /100 | #39 | Exceptional 14.7% |
| Pima | 100.0 /100 | #40 | Exceptional 14.8% |
| Indians (Asian) | 100.0 /100 | #41 | Exceptional 14.8% |
| Immigrants | Nepal | 100.0 /100 | #42 | Exceptional 14.8% |
| Immigrants | Eritrea | 100.0 /100 | #43 | Exceptional 14.8% |
| Salvadorans | 100.0 /100 | #44 | Exceptional 14.9% |
| Immigrants | Somalia | 100.0 /100 | #45 | Exceptional 14.9% |