Immigrants from Western Asia vs Ute Male Poverty
COMPARE
Immigrants from Western Asia
Ute
Male Poverty
Male Poverty Comparison
Immigrants from Western Asia
Ute
11.8%
MALE POVERTY
9.8/ 100
METRIC RATING
203rd/ 347
METRIC RANK
16.2%
MALE POVERTY
0.0/ 100
METRIC RATING
331st/ 347
METRIC RANK
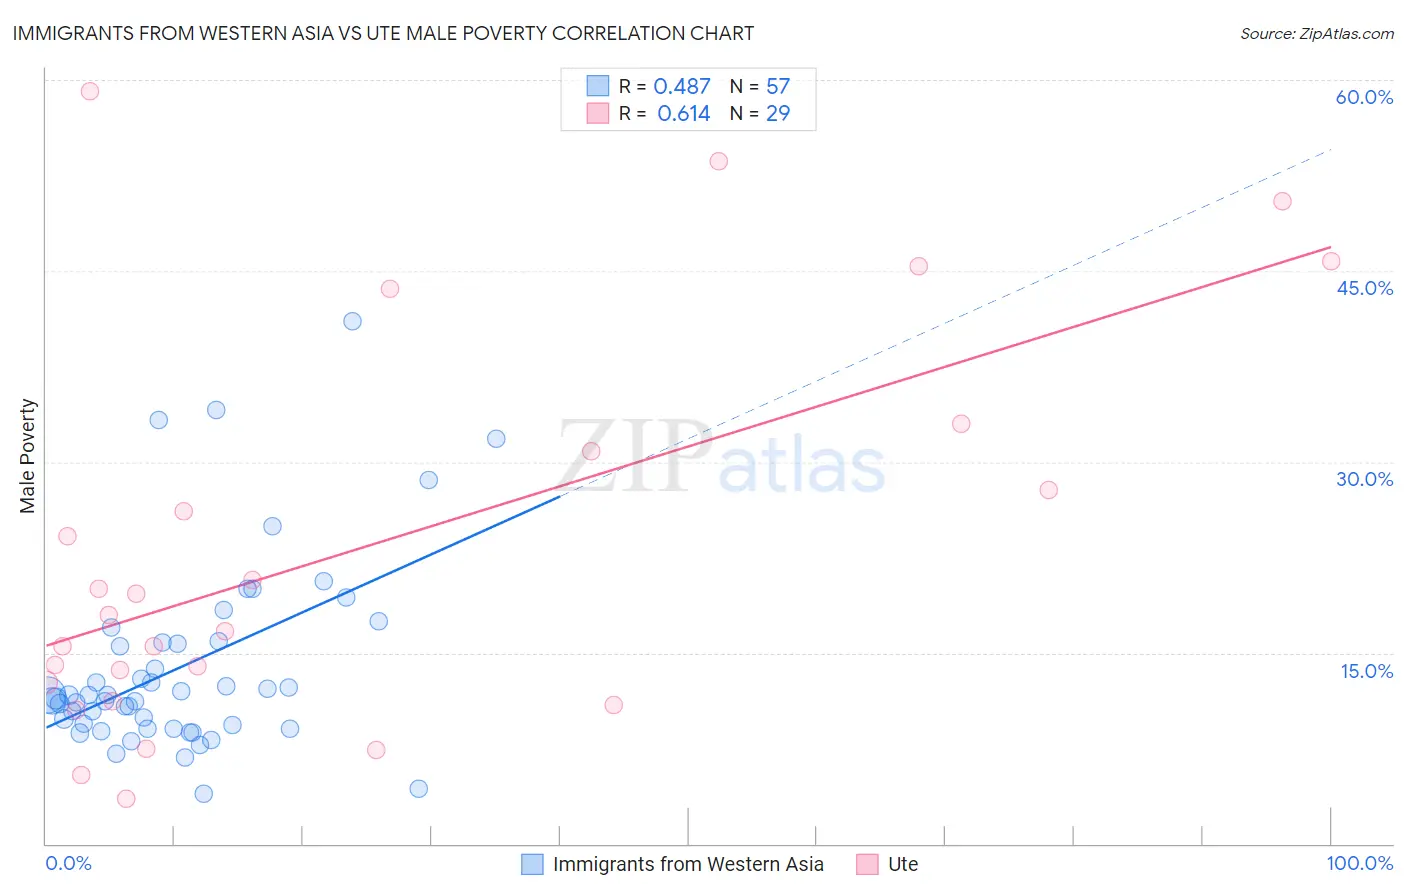
Immigrants from Western Asia vs Ute Male Poverty Correlation Chart
The statistical analysis conducted on geographies consisting of 404,054,336 people shows a moderate positive correlation between the proportion of Immigrants from Western Asia and poverty level among males in the United States with a correlation coefficient (R) of 0.487 and weighted average of 11.8%. Similarly, the statistical analysis conducted on geographies consisting of 55,650,694 people shows a significant positive correlation between the proportion of Ute and poverty level among males in the United States with a correlation coefficient (R) of 0.614 and weighted average of 16.2%, a difference of 37.7%.
Male Poverty Correlation Summary
| Measurement | Immigrants from Western Asia | Ute |
| Minimum | 4.0% | 3.5% |
| Maximum | 41.1% | 59.1% |
| Range | 37.1% | 55.6% |
| Mean | 13.9% | 23.3% |
| Median | 11.7% | 17.9% |
| Interquartile 25% (IQ1) | 9.2% | 12.0% |
| Interquartile 75% (IQ3) | 15.9% | 31.9% |
| Interquartile Range (IQR) | 6.7% | 20.0% |
| Standard Deviation (Sample) | 7.5% | 15.6% |
| Standard Deviation (Population) | 7.4% | 15.3% |
Similar Demographics by Male Poverty
Demographics Similar to Immigrants from Western Asia by Male Poverty
In terms of male poverty, the demographic groups most similar to Immigrants from Western Asia are Aleut (11.8%, a difference of 0.14%), Immigrants from Uganda (11.8%, a difference of 0.36%), Spaniard (11.7%, a difference of 0.86%), Immigrants from Lebanon (11.7%, a difference of 0.87%), and Spanish (11.7%, a difference of 0.97%).
| Demographics | Rating | Rank | Male Poverty |
| Hmong | 15.8 /100 | #196 | Poor 11.6% |
| Delaware | 15.4 /100 | #197 | Poor 11.7% |
| Iraqis | 14.7 /100 | #198 | Poor 11.7% |
| Spanish | 14.1 /100 | #199 | Poor 11.7% |
| Immigrants | Lebanon | 13.6 /100 | #200 | Poor 11.7% |
| Spaniards | 13.5 /100 | #201 | Poor 11.7% |
| Aleuts | 10.4 /100 | #202 | Poor 11.8% |
| Immigrants | Western Asia | 9.8 /100 | #203 | Tragic 11.8% |
| Immigrants | Uganda | 8.5 /100 | #204 | Tragic 11.8% |
| Panamanians | 6.2 /100 | #205 | Tragic 11.9% |
| Immigrants | Eastern Africa | 5.4 /100 | #206 | Tragic 12.0% |
| Malaysians | 5.2 /100 | #207 | Tragic 12.0% |
| Immigrants | Immigrants | 4.5 /100 | #208 | Tragic 12.0% |
| Immigrants | Azores | 4.3 /100 | #209 | Tragic 12.0% |
| Moroccans | 4.2 /100 | #210 | Tragic 12.0% |
Demographics Similar to Ute by Male Poverty
In terms of male poverty, the demographic groups most similar to Ute are Immigrants from Dominican Republic (16.2%, a difference of 0.34%), Dominican (16.1%, a difference of 0.99%), Black/African American (15.8%, a difference of 2.7%), Paiute (15.8%, a difference of 2.8%), and Houma (16.7%, a difference of 3.0%).
| Demographics | Rating | Rank | Male Poverty |
| Menominee | 0.0 /100 | #324 | Tragic 15.3% |
| Yakama | 0.0 /100 | #325 | Tragic 15.3% |
| Central American Indians | 0.0 /100 | #326 | Tragic 15.3% |
| Paiute | 0.0 /100 | #327 | Tragic 15.8% |
| Blacks/African Americans | 0.0 /100 | #328 | Tragic 15.8% |
| Dominicans | 0.0 /100 | #329 | Tragic 16.1% |
| Immigrants | Dominican Republic | 0.0 /100 | #330 | Tragic 16.2% |
| Ute | 0.0 /100 | #331 | Tragic 16.2% |
| Houma | 0.0 /100 | #332 | Tragic 16.7% |
| Natives/Alaskans | 0.0 /100 | #333 | Tragic 16.9% |
| Cheyenne | 0.0 /100 | #334 | Tragic 17.6% |
| Apache | 0.0 /100 | #335 | Tragic 17.7% |
| Pueblo | 0.0 /100 | #336 | Tragic 18.5% |
| Sioux | 0.0 /100 | #337 | Tragic 18.7% |
| Crow | 0.0 /100 | #338 | Tragic 19.1% |