Immigrants from Cabo Verde vs Spanish American Indian Single Father Poverty
COMPARE
Immigrants from Cabo Verde
Spanish American Indian
Single Father Poverty
Single Father Poverty Comparison
Immigrants from Cabo Verde
Spanish American Indians
17.0%
SINGLE FATHER POVERTY
1.6/ 100
METRIC RATING
243rd/ 347
METRIC RANK
14.4%
SINGLE FATHER POVERTY
100.0/ 100
METRIC RATING
26th/ 347
METRIC RANK
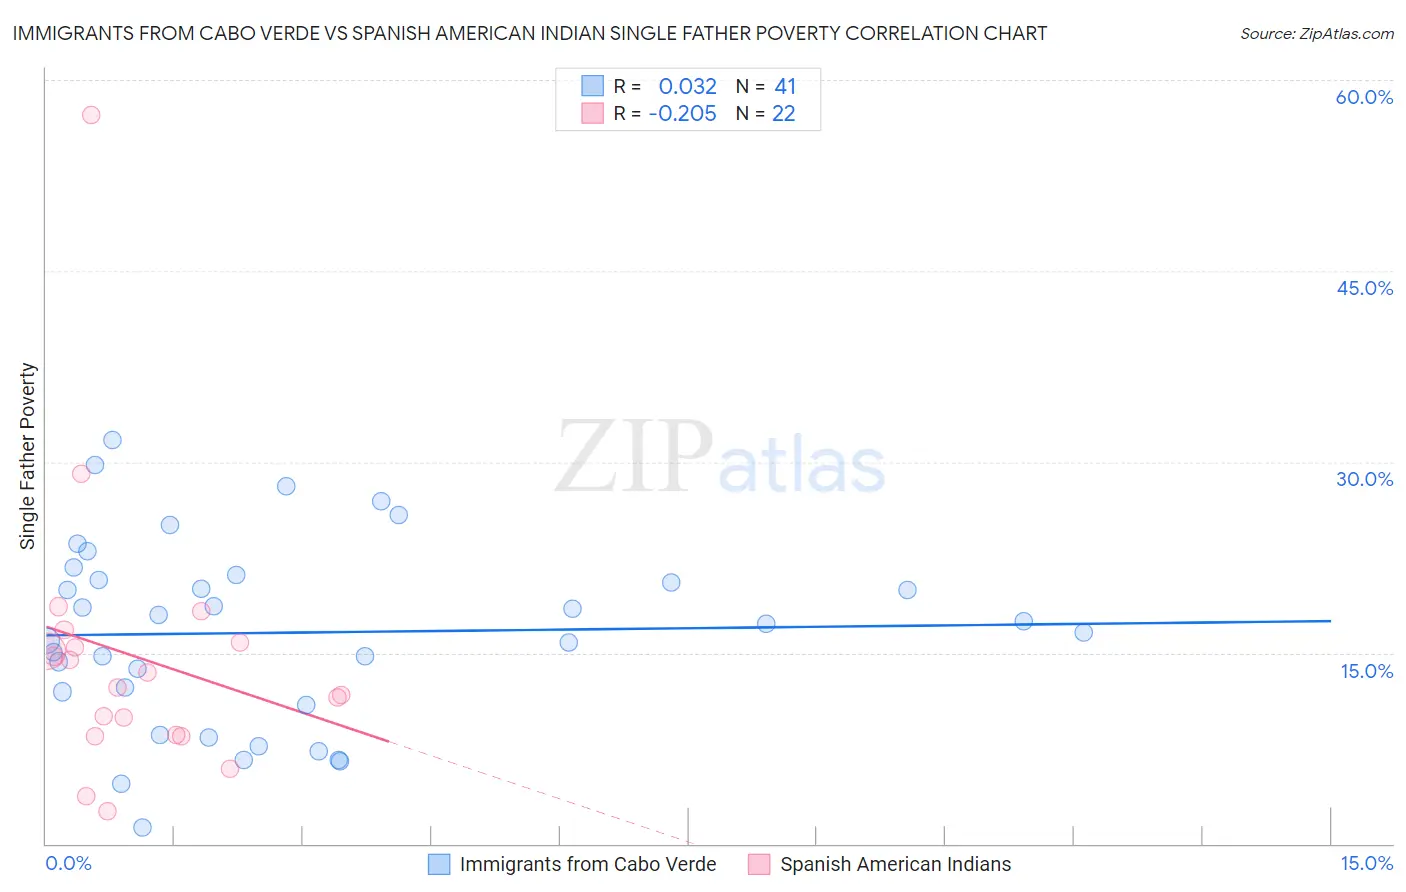
Immigrants from Cabo Verde vs Spanish American Indian Single Father Poverty Correlation Chart
The statistical analysis conducted on geographies consisting of 35,352,223 people shows no correlation between the proportion of Immigrants from Cabo Verde and poverty level among single fathers in the United States with a correlation coefficient (R) of 0.032 and weighted average of 17.0%. Similarly, the statistical analysis conducted on geographies consisting of 69,773,093 people shows a weak negative correlation between the proportion of Spanish American Indians and poverty level among single fathers in the United States with a correlation coefficient (R) of -0.205 and weighted average of 14.4%, a difference of 18.1%.
Single Father Poverty Correlation Summary
| Measurement | Immigrants from Cabo Verde | Spanish American Indian |
| Minimum | 1.3% | 2.6% |
| Maximum | 31.8% | 57.2% |
| Range | 30.4% | 54.6% |
| Mean | 16.6% | 14.6% |
| Median | 17.3% | 12.9% |
| Interquartile 25% (IQ1) | 11.4% | 8.5% |
| Interquartile 75% (IQ3) | 20.9% | 15.8% |
| Interquartile Range (IQR) | 9.5% | 7.3% |
| Standard Deviation (Sample) | 7.2% | 11.1% |
| Standard Deviation (Population) | 7.1% | 10.8% |
Similar Demographics by Single Father Poverty
Demographics Similar to Immigrants from Cabo Verde by Single Father Poverty
In terms of single father poverty, the demographic groups most similar to Immigrants from Cabo Verde are Honduran (17.0%, a difference of 0.020%), Trinidadian and Tobagonian (17.0%, a difference of 0.060%), Immigrants from Ireland (17.1%, a difference of 0.10%), Greek (17.1%, a difference of 0.20%), and Czechoslovakian (17.1%, a difference of 0.20%).
| Demographics | Rating | Rank | Single Father Poverty |
| Immigrants | Germany | 2.9 /100 | #236 | Tragic 16.9% |
| Sub-Saharan Africans | 2.9 /100 | #237 | Tragic 16.9% |
| Immigrants | Saudi Arabia | 2.7 /100 | #238 | Tragic 16.9% |
| Bermudans | 2.6 /100 | #239 | Tragic 16.9% |
| Finns | 2.6 /100 | #240 | Tragic 16.9% |
| Czechs | 2.3 /100 | #241 | Tragic 17.0% |
| Moroccans | 2.1 /100 | #242 | Tragic 17.0% |
| Immigrants | Cabo Verde | 1.6 /100 | #243 | Tragic 17.0% |
| Hondurans | 1.6 /100 | #244 | Tragic 17.0% |
| Trinidadians and Tobagonians | 1.5 /100 | #245 | Tragic 17.0% |
| Immigrants | Ireland | 1.4 /100 | #246 | Tragic 17.1% |
| Greeks | 1.3 /100 | #247 | Tragic 17.1% |
| Czechoslovakians | 1.3 /100 | #248 | Tragic 17.1% |
| Canadians | 1.3 /100 | #249 | Tragic 17.1% |
| Austrians | 1.1 /100 | #250 | Tragic 17.1% |
Demographics Similar to Spanish American Indians by Single Father Poverty
In terms of single father poverty, the demographic groups most similar to Spanish American Indians are Nepalese (14.4%, a difference of 0.050%), Iranian (14.4%, a difference of 0.42%), Immigrants from Egypt (14.4%, a difference of 0.46%), Immigrants from South Eastern Asia (14.4%, a difference of 0.46%), and Immigrants from South Central Asia (14.5%, a difference of 0.58%).
| Demographics | Rating | Rank | Single Father Poverty |
| Immigrants | Iraq | 100.0 /100 | #19 | Exceptional 14.3% |
| Immigrants | Singapore | 100.0 /100 | #20 | Exceptional 14.3% |
| Immigrants | Afghanistan | 100.0 /100 | #21 | Exceptional 14.3% |
| Taiwanese | 100.0 /100 | #22 | Exceptional 14.3% |
| Immigrants | Egypt | 100.0 /100 | #23 | Exceptional 14.4% |
| Immigrants | South Eastern Asia | 100.0 /100 | #24 | Exceptional 14.4% |
| Iranians | 100.0 /100 | #25 | Exceptional 14.4% |
| Spanish American Indians | 100.0 /100 | #26 | Exceptional 14.4% |
| Nepalese | 100.0 /100 | #27 | Exceptional 14.4% |
| Immigrants | South Central Asia | 100.0 /100 | #28 | Exceptional 14.5% |
| Somalis | 100.0 /100 | #29 | Exceptional 14.5% |
| Thais | 100.0 /100 | #30 | Exceptional 14.5% |
| Icelanders | 100.0 /100 | #31 | Exceptional 14.5% |
| Asians | 100.0 /100 | #32 | Exceptional 14.6% |
| Okinawans | 100.0 /100 | #33 | Exceptional 14.6% |