Alsatian vs Arab Child Poverty Among Boys Under 16

COMPARE

Alsatian
Race
Ancestry
AfghanAfricanAlaska NativeAlaskan AthabascanAlbanianAleutAlsatianAmericanApacheArapahoArgentineanArmenianAssyrian/Chaldean/SyriacAustralianAustrianBahamianBangladeshiBarbadianBasqueBelgianBelizeanBermudanBhutaneseBlackfeetBolivianBrazilianBritishBritish West IndianBulgarianBurmeseCajunCambodianCanadianCape VerdeanCarpatho RusynCelticCentral AmericanCentral American IndianCherokeeCheyenneChickasawChileanChineseChippewaChoctawColombianColvilleComancheCosta RicanCreeCreekCroatianCrowCubanCypriotCzechCzechoslovakianDanishDelawareDominicanDutchDutch West IndianEastern EuropeanEcuadorianEgyptianEnglishEstonianEthiopianEuropeanFijianFilipinoFinnishFrenchFrench American IndianFrench CanadianGermanGerman RussianGhanaianGreekGuamanian/ChamorroGuatemalanGuyaneseHaitianHmongHonduranHopiHoumaHungarianIcelanderIndian (Asian)IndonesianInupiatIranianIraqiIrishIroquoisIsraeliItalianJamaicanJapaneseJordanianKenyanKiowaKoreanLaotianLatvianLebaneseLiberianLithuanianLumbeeLuxembourgerMacedonianMalaysianMalteseMarshalleseMenomineeMexicanMexican American IndianMongolianMoroccanNative HawaiianNavajoNepaleseNew ZealanderNicaraguanNigerianNorthern EuropeanNorwegianOkinawanOsageOttawaPaiutePakistaniPalestinianPanamanianParaguayanPennsylvania GermanPeruvianPimaPolishPortuguesePotawatomiPuebloPuerto RicanPuget Sound SalishRomanianRussianSalvadoranSamoanScandinavianScotch-IrishScottishSeminoleSenegaleseSerbianShoshoneSierra LeoneanSiouxSlavicSlovakSloveneSomaliSouth AfricanSouth AmericanSouth American IndianSoviet UnionSpaniardSpanishSpanish AmericanSpanish American IndianSri LankanSubsaharan AfricanSudaneseSwedishSwissSyrianTaiwaneseThaiTlingit-HaidaTohono O'OdhamTonganTrinidadian and TobagonianTsimshianTurkishU.S. Virgin IslanderUgandanUkrainianUruguayanUteVenezuelanVietnameseWelshWest IndianYakamaYaquiYugoslavianYumanYup'ikZimbabwean
Immigration
NonimmigrantsImmigrantsAfghanistanAfricaAlbaniaArgentinaArmeniaAsiaAustraliaAustriaBahamasBangladeshBarbadosBelarusBelgiumBelizeBoliviaBosnia and HerzegovinaBrazilBulgariaBurma/MyanmarCabo VerdeCambodiaCameroonCanadaCaribbeanCentral AmericaChileChinaColombiaCongoCosta RicaCroatiaCubaCzechoslovakiaDenmarkDominicaDominican RepublicEastern AfricaEastern AsiaEastern EuropeEcuadorEgyptEl SalvadorEnglandEritreaEthiopiaEuropeFijiFranceGermanyGhanaGreeceGrenadaGuatemalaGuyanaHaitiHondurasHong KongHungaryIndiaIndonesiaIranIraqIrelandIsraelItalyJamaicaJapanJordanKazakhstanKenyaKoreaKuwaitLaosLatin AmericaLatviaLebanonLiberiaLithuaniaMalaysiaMexicoMicronesiaMiddle AfricaMoldovaMoroccoNepalNetherlandsNicaraguaNigeriaNorth AmericaNorth MacedoniaNorthern AfricaNorthern EuropeNorwayOceaniaPakistanPanamaPeruPhilippinesPolandPortugalRomaniaRussiaSaudi ArabiaScotlandSenegalSerbiaSierra LeoneSingaporeSomaliaSouth AfricaSouth AmericaSouth Central AsiaSouth Eastern AsiaSouthern EuropeSpainSri LankaSt. Vincent and the GrenadinesSudanSwedenSwitzerlandSyriaTaiwanThailandTrinidad and TobagoTurkeyUgandaUkraineUruguayUzbekistanVenezuelaVietnamWest IndiesWestern AfricaWestern AsiaWestern EuropeYemenZaireZimbabweAzores
Arab
Race
Ancestry
AfghanAfricanAlaska NativeAlaskan AthabascanAlbanianAleutAmericanApacheArabArapahoArgentineanArmenianAssyrian/Chaldean/SyriacAustralianAustrianBahamianBangladeshiBarbadianBasqueBelgianBelizeanBermudanBhutaneseBlackfeetBolivianBrazilianBritishBritish West IndianBulgarianBurmeseCajunCambodianCanadianCape VerdeanCarpatho RusynCelticCentral AmericanCentral American IndianCherokeeCheyenneChickasawChileanChineseChippewaChoctawColombianColvilleComancheCosta RicanCreeCreekCroatianCrowCubanCypriotCzechCzechoslovakianDanishDelawareDominicanDutchDutch West IndianEastern EuropeanEcuadorianEgyptianEnglishEstonianEthiopianEuropeanFijianFilipinoFinnishFrenchFrench American IndianFrench CanadianGermanGerman RussianGhanaianGreekGuamanian/ChamorroGuatemalanGuyaneseHaitianHmongHonduranHopiHoumaHungarianIcelanderIndian (Asian)IndonesianInupiatIranianIraqiIrishIroquoisIsraeliItalianJamaicanJapaneseJordanianKenyanKiowaKoreanLaotianLatvianLebaneseLiberianLithuanianLumbeeLuxembourgerMacedonianMalaysianMalteseMarshalleseMenomineeMexicanMexican American IndianMongolianMoroccanNative HawaiianNavajoNepaleseNew ZealanderNicaraguanNigerianNorthern EuropeanNorwegianOkinawanOsageOttawaPaiutePakistaniPalestinianPanamanianParaguayanPennsylvania GermanPeruvianPimaPolishPortuguesePotawatomiPuebloPuerto RicanPuget Sound SalishRomanianRussianSalvadoranSamoanScandinavianScotch-IrishScottishSeminoleSenegaleseSerbianShoshoneSierra LeoneanSiouxSlavicSlovakSloveneSomaliSouth AfricanSouth AmericanSouth American IndianSoviet UnionSpaniardSpanishSpanish AmericanSpanish American IndianSri LankanSubsaharan AfricanSudaneseSwedishSwissSyrianTaiwaneseThaiTlingit-HaidaTohono O'OdhamTonganTrinidadian and TobagonianTsimshianTurkishU.S. Virgin IslanderUgandanUkrainianUruguayanUteVenezuelanVietnameseWelshWest IndianYakamaYaquiYugoslavianYumanYup'ikZimbabwean
Immigration
NonimmigrantsImmigrantsAfghanistanAfricaAlbaniaArgentinaArmeniaAsiaAustraliaAustriaBahamasBangladeshBarbadosBelarusBelgiumBelizeBoliviaBosnia and HerzegovinaBrazilBulgariaBurma/MyanmarCabo VerdeCambodiaCameroonCanadaCaribbeanCentral AmericaChileChinaColombiaCongoCosta RicaCroatiaCubaCzechoslovakiaDenmarkDominicaDominican RepublicEastern AfricaEastern AsiaEastern EuropeEcuadorEgyptEl SalvadorEnglandEritreaEthiopiaEuropeFijiFranceGermanyGhanaGreeceGrenadaGuatemalaGuyanaHaitiHondurasHong KongHungaryIndiaIndonesiaIranIraqIrelandIsraelItalyJamaicaJapanJordanKazakhstanKenyaKoreaKuwaitLaosLatin AmericaLatviaLebanonLiberiaLithuaniaMalaysiaMexicoMicronesiaMiddle AfricaMoldovaMoroccoNepalNetherlandsNicaraguaNigeriaNorth AmericaNorth MacedoniaNorthern AfricaNorthern EuropeNorwayOceaniaPakistanPanamaPeruPhilippinesPolandPortugalRomaniaRussiaSaudi ArabiaScotlandSenegalSerbiaSierra LeoneSingaporeSomaliaSouth AfricaSouth AmericaSouth Central AsiaSouth Eastern AsiaSouthern EuropeSpainSri LankaSt. Vincent and the GrenadinesSudanSwedenSwitzerlandSyriaTaiwanThailandTrinidad and TobagoTurkeyUgandaUkraineUruguayUzbekistanVenezuelaVietnamWest IndiesWestern AfricaWestern AsiaWestern EuropeYemenZaireZimbabweAzores
Child Poverty Among Boys Under 16
Income
Poverty
Unemployment
Labor Participation
Family Structure
Vehicle Availability
Education Level
Disability

Child Poverty Among Boys Under 16 Comparison

Alsatians

Arabs

Tragic
Fair
19.1%
CHILD POVERTY AMONG BOYS UNDER 16
0.3/ 100
METRIC RATING
249th/ 347
METRIC RANK
16.8%
CHILD POVERTY AMONG BOYS UNDER 16
31.1/ 100
METRIC RATING
190th/ 347
METRIC RANK

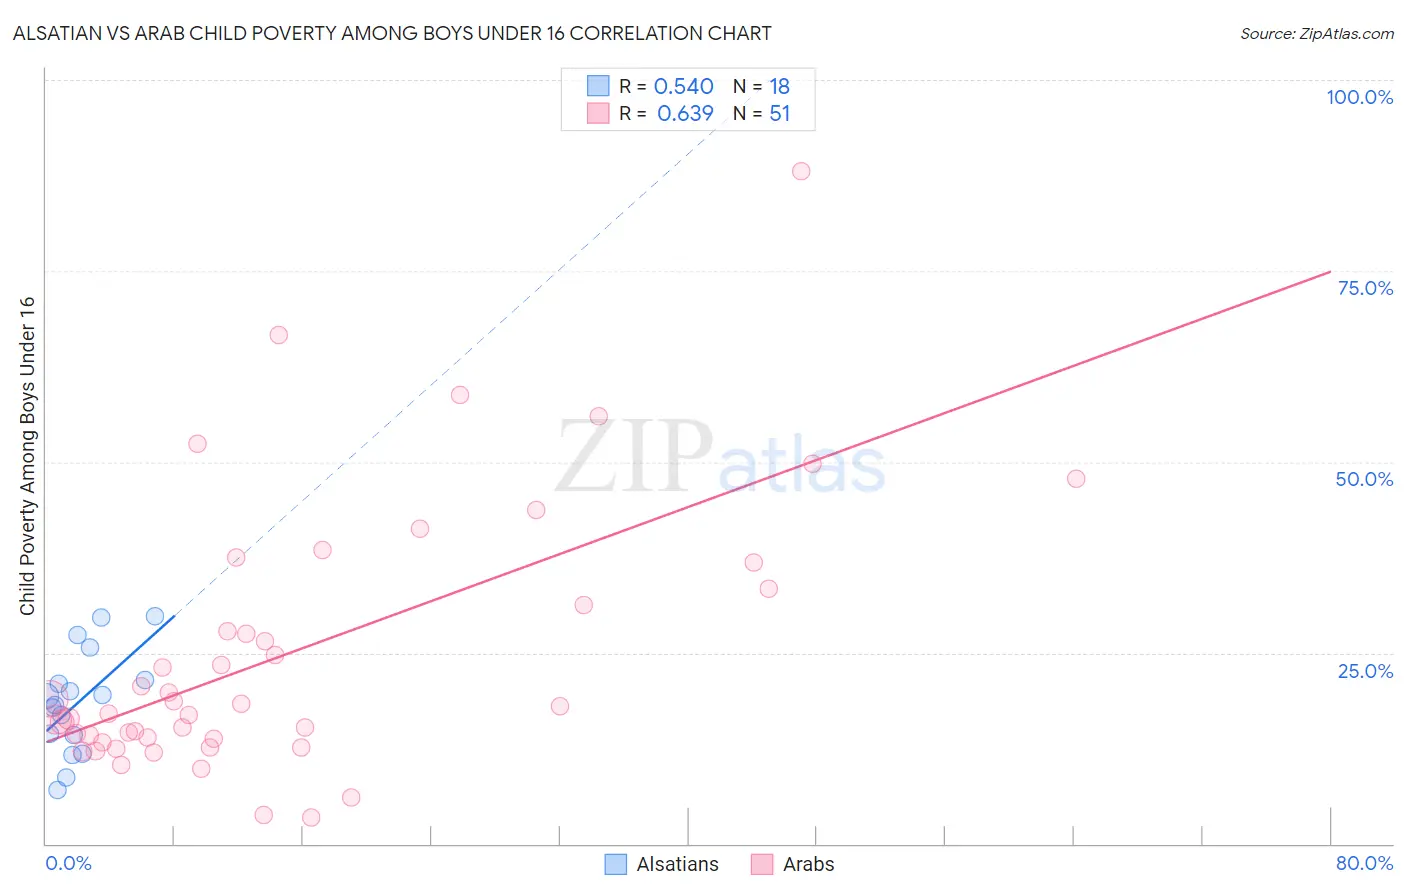
Alsatian vs Arab Child Poverty Among Boys Under 16 Correlation Chart

The statistical analysis conducted on geographies consisting of 82,051,026 people shows a substantial positive correlation between the proportion of Alsatians and poverty level among boys under the age of 16 in the United States with a correlation coefficient (R) of 0.540 and weighted average of 19.1%. Similarly, the statistical analysis conducted on geographies consisting of 475,195,630 people shows a significant positive correlation between the proportion of Arabs and poverty level among boys under the age of 16 in the United States with a correlation coefficient (R) of 0.639 and weighted average of 16.8%, a difference of 13.6%.
Alsatian vs Arab Child Poverty Among Boys Under 16

Child Poverty Among Boys Under 16 Correlation Summary

MeasurementAlsatianArab
Minimum7.1%3.4%
Maximum29.7%88.0%
Range22.7%84.6%
Mean18.6%24.9%
Median18.7%17.9%
Interquartile 25% (IQ1)14.3%13.7%
Interquartile 75% (IQ3)21.5%33.3%
Interquartile Range (IQR)7.2%19.6%
Standard Deviation (Sample)6.7%17.4%
Standard Deviation (Population)6.5%17.2%

Similar Demographics by Child Poverty Among Boys Under 16

Demographics Similar to Alsatians by Child Poverty Among Boys Under 16

In terms of child poverty among boys under 16, the demographic groups most similar to Alsatians are Salvadoran (19.0%, a difference of 0.17%), Immigrants from Trinidad and Tobago (19.0%, a difference of 0.25%), Immigrants from Nicaragua (19.0%, a difference of 0.37%), Cree (19.0%, a difference of 0.57%), and Immigrants from Middle Africa (18.9%, a difference of 0.70%).
DemographicsRating | RankChild Poverty Among Boys Under 16
Ghanaians
0.5
/100
|
#242
Tragic
18.9%
Immigrants | Azores
0.4
/100
|
#243
Tragic
18.9%
Immigrants | Middle Africa
0.4
/100
|
#244
Tragic
18.9%
Cree
0.4
/100
|
#245
Tragic
19.0%
Immigrants | Nicaragua
0.4
/100
|
#246
Tragic
19.0%
Immigrants | Trinidad and Tobago
0.3
/100
|
#247
Tragic
19.0%
Salvadorans
0.3
/100
|
#248
Tragic
19.0%
Alsatians
0.3
/100
|
#249
Tragic
19.1%
Immigrants | Burma/Myanmar
0.2
/100
|
#250
Tragic
19.2%
French American Indians
0.2
/100
|
#251
Tragic
19.2%
Immigrants | Western Africa
0.2
/100
|
#252
Tragic
19.3%
Liberians
0.2
/100
|
#253
Tragic
19.3%
Trinidadians and Tobagonians
0.2
/100
|
#254
Tragic
19.3%
Ecuadorians
0.2
/100
|
#255
Tragic
19.3%
Immigrants | Liberia
0.2
/100
|
#256
Tragic
19.3%

Demographics Similar to Arabs by Child Poverty Among Boys Under 16

In terms of child poverty among boys under 16, the demographic groups most similar to Arabs are Alaska Native (16.8%, a difference of 0.17%), Immigrants from Morocco (16.7%, a difference of 0.42%), Immigrants from South America (16.7%, a difference of 0.81%), Immigrants from Costa Rica (16.7%, a difference of 0.82%), and Hmong (16.6%, a difference of 0.90%).
DemographicsRating | RankChild Poverty Among Boys Under 16
Kenyans
41.0
/100
|
#183
Average
16.6%
Celtics
40.6
/100
|
#184
Average
16.6%
Immigrants | Western Asia
40.4
/100
|
#185
Average
16.6%
Hmong
38.4
/100
|
#186
Fair
16.6%
Immigrants | Costa Rica
37.8
/100
|
#187
Fair
16.7%
Immigrants | South America
37.7
/100
|
#188
Fair
16.7%
Immigrants | Morocco
34.5
/100
|
#189
Fair
16.7%
Arabs
31.1
/100
|
#190
Fair
16.8%
Alaska Natives
29.8
/100
|
#191
Fair
16.8%
Immigrants | Uganda
21.6
/100
|
#192
Fair
17.0%
Immigrants | Iraq
21.6
/100
|
#193
Fair
17.0%
Immigrants | Lebanon
21.2
/100
|
#194
Fair
17.0%
Spanish
20.8
/100
|
#195
Fair
17.0%
Spaniards
20.5
/100
|
#196
Fair
17.1%
Immigrants | Kenya
20.1
/100
|
#197
Fair
17.1%