Aleut vs Swiss In Labor Force | Age 25-29
COMPARE
Aleut
Swiss
In Labor Force | Age 25-29
In Labor Force | Age 25-29 Comparison
Aleuts
Swiss
83.4%
IN LABOR FORCE | AGE 25-29
0.0/ 100
METRIC RATING
266th/ 347
METRIC RANK
84.7%
IN LABOR FORCE | AGE 25-29
64.7/ 100
METRIC RATING
150th/ 347
METRIC RANK
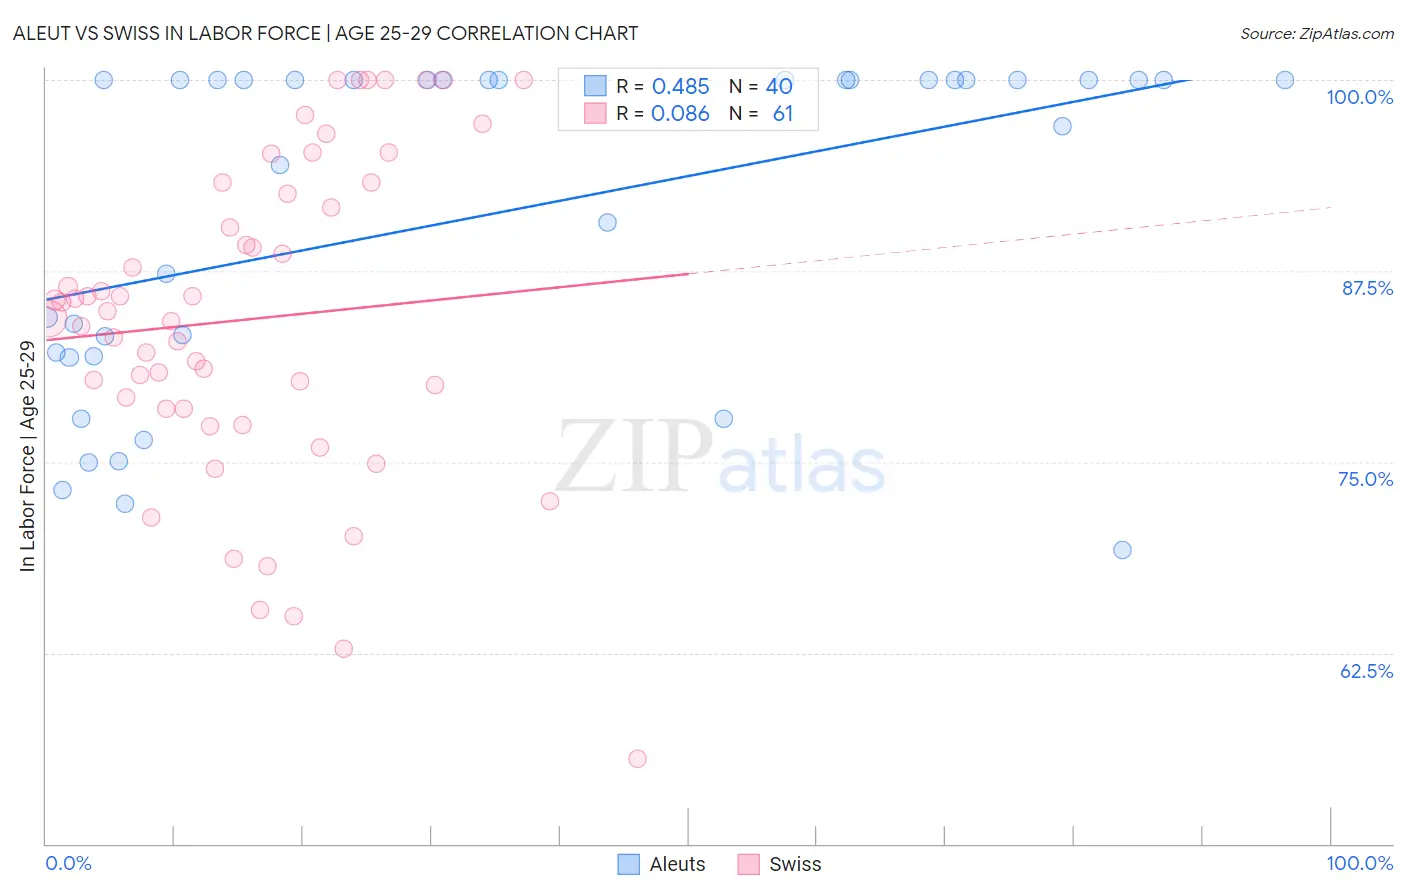
Aleut vs Swiss In Labor Force | Age 25-29 Correlation Chart
The statistical analysis conducted on geographies consisting of 61,770,091 people shows a moderate positive correlation between the proportion of Aleuts and labor force participation rate among population between the ages 25 and 29 in the United States with a correlation coefficient (R) of 0.485 and weighted average of 83.4%. Similarly, the statistical analysis conducted on geographies consisting of 464,613,685 people shows a slight positive correlation between the proportion of Swiss and labor force participation rate among population between the ages 25 and 29 in the United States with a correlation coefficient (R) of 0.086 and weighted average of 84.7%, a difference of 1.6%.
In Labor Force | Age 25-29 Correlation Summary
| Measurement | Aleut | Swiss |
| Minimum | 69.2% | 55.6% |
| Maximum | 100.0% | 100.0% |
| Range | 30.8% | 44.4% |
| Mean | 91.2% | 84.4% |
| Median | 100.0% | 84.8% |
| Interquartile 25% (IQ1) | 82.0% | 78.5% |
| Interquartile 75% (IQ3) | 100.0% | 92.9% |
| Interquartile Range (IQR) | 18.0% | 14.4% |
| Standard Deviation (Sample) | 10.7% | 10.5% |
| Standard Deviation (Population) | 10.5% | 10.4% |
Similar Demographics by In Labor Force | Age 25-29
Demographics Similar to Aleuts by In Labor Force | Age 25-29
In terms of in labor force | age 25-29, the demographic groups most similar to Aleuts are Spanish American (83.4%, a difference of 0.010%), Immigrants from Lebanon (83.4%, a difference of 0.020%), Immigrants from Barbados (83.4%, a difference of 0.020%), Puget Sound Salish (83.5%, a difference of 0.040%), and Cuban (83.5%, a difference of 0.040%).
| Demographics | Rating | Rank | In Labor Force | Age 25-29 |
| Spanish | 0.1 /100 | #259 | Tragic 83.6% |
| Immigrants | Bahamas | 0.1 /100 | #260 | Tragic 83.6% |
| Pennsylvania Germans | 0.1 /100 | #261 | Tragic 83.6% |
| Immigrants | Fiji | 0.1 /100 | #262 | Tragic 83.6% |
| West Indians | 0.1 /100 | #263 | Tragic 83.5% |
| Puget Sound Salish | 0.1 /100 | #264 | Tragic 83.5% |
| Cubans | 0.1 /100 | #265 | Tragic 83.5% |
| Aleuts | 0.0 /100 | #266 | Tragic 83.4% |
| Spanish Americans | 0.0 /100 | #267 | Tragic 83.4% |
| Immigrants | Lebanon | 0.0 /100 | #268 | Tragic 83.4% |
| Immigrants | Barbados | 0.0 /100 | #269 | Tragic 83.4% |
| Basques | 0.0 /100 | #270 | Tragic 83.4% |
| Hondurans | 0.0 /100 | #271 | Tragic 83.4% |
| Immigrants | Caribbean | 0.0 /100 | #272 | Tragic 83.4% |
| Immigrants | Dominica | 0.0 /100 | #273 | Tragic 83.4% |
Demographics Similar to Swiss by In Labor Force | Age 25-29
In terms of in labor force | age 25-29, the demographic groups most similar to Swiss are Immigrants from England (84.7%, a difference of 0.0%), Peruvian (84.7%, a difference of 0.0%), Colombian (84.7%, a difference of 0.010%), Immigrants from Pakistan (84.7%, a difference of 0.020%), and Immigrants from Taiwan (84.7%, a difference of 0.020%).
| Demographics | Rating | Rank | In Labor Force | Age 25-29 |
| Sri Lankans | 69.2 /100 | #143 | Good 84.8% |
| Immigrants | Laos | 69.0 /100 | #144 | Good 84.8% |
| Immigrants | Senegal | 68.3 /100 | #145 | Good 84.8% |
| Icelanders | 68.2 /100 | #146 | Good 84.8% |
| Immigrants | Asia | 68.2 /100 | #147 | Good 84.8% |
| Immigrants | England | 65.2 /100 | #148 | Good 84.7% |
| Peruvians | 64.7 /100 | #149 | Good 84.7% |
| Swiss | 64.7 /100 | #150 | Good 84.7% |
| Colombians | 62.8 /100 | #151 | Good 84.7% |
| Immigrants | Pakistan | 62.7 /100 | #152 | Good 84.7% |
| Immigrants | Taiwan | 62.2 /100 | #153 | Good 84.7% |
| Immigrants | Sri Lanka | 61.7 /100 | #154 | Good 84.7% |
| Indians (Asian) | 61.6 /100 | #155 | Good 84.7% |
| French | 61.0 /100 | #156 | Good 84.7% |
| British | 60.4 /100 | #157 | Good 84.7% |