Aleut vs Immigrants from Trinidad and Tobago Unemployment Among Ages 60 to 64 years
COMPARE
Aleut
Immigrants from Trinidad and Tobago
Unemployment Among Ages 60 to 64 years
Unemployment Among Ages 60 to 64 years Comparison
Aleuts
Immigrants from Trinidad and Tobago
6.8%
UNEMPLOYMENT AMONG AGES 60 TO 64 YEARS
0.0/ 100
METRIC RATING
342nd/ 347
METRIC RANK
5.3%
UNEMPLOYMENT AMONG AGES 60 TO 64 YEARS
0.0/ 100
METRIC RATING
290th/ 347
METRIC RANK
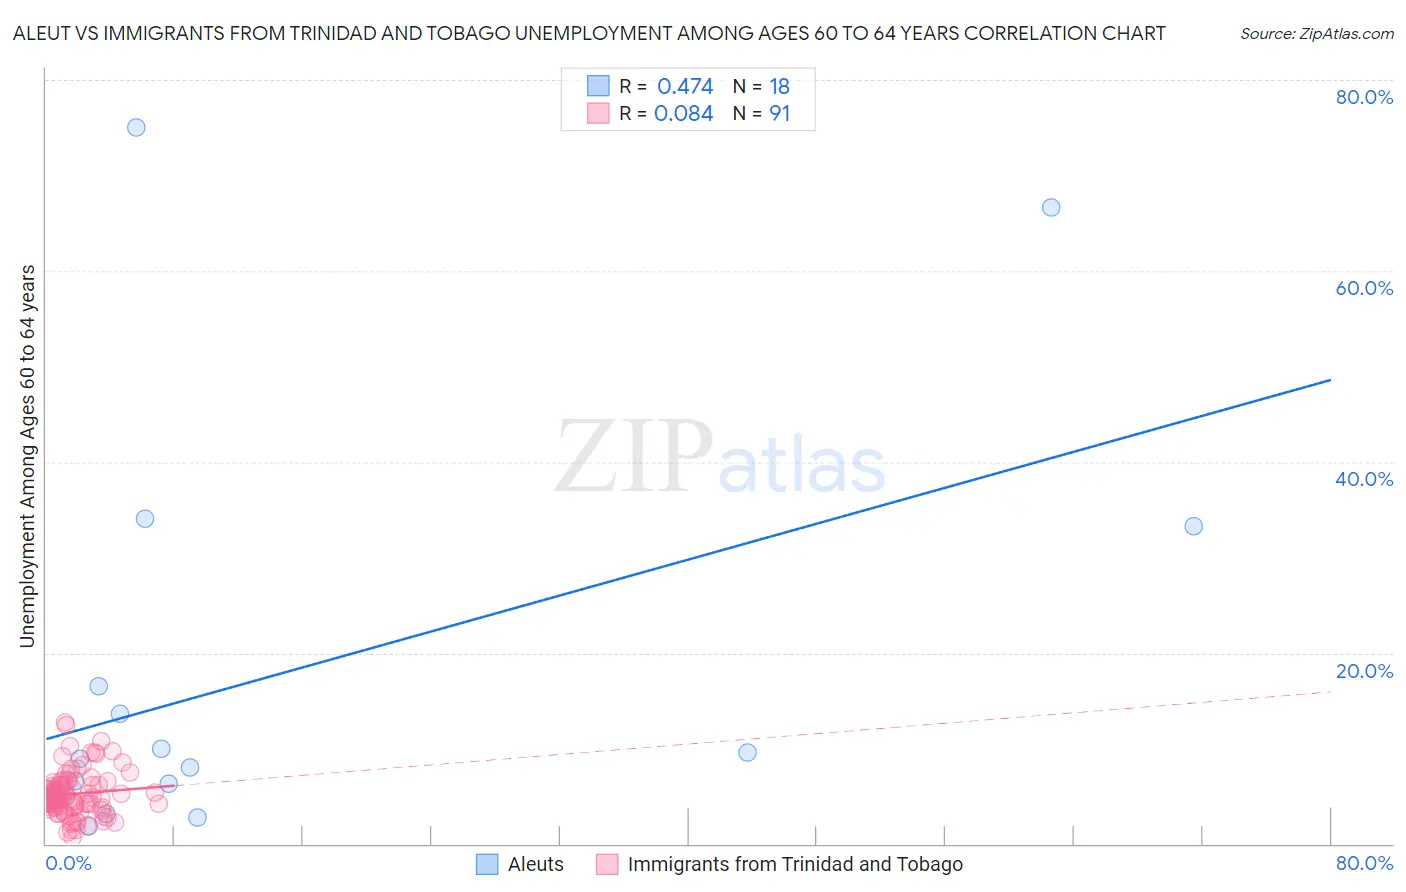
Aleut vs Immigrants from Trinidad and Tobago Unemployment Among Ages 60 to 64 years Correlation Chart
The statistical analysis conducted on geographies consisting of 59,800,117 people shows a moderate positive correlation between the proportion of Aleuts and unemployment rate among population between the ages 60 and 64 in the United States with a correlation coefficient (R) of 0.474 and weighted average of 6.8%. Similarly, the statistical analysis conducted on geographies consisting of 212,065,319 people shows a slight positive correlation between the proportion of Immigrants from Trinidad and Tobago and unemployment rate among population between the ages 60 and 64 in the United States with a correlation coefficient (R) of 0.084 and weighted average of 5.3%, a difference of 28.0%.
Unemployment Among Ages 60 to 64 years Correlation Summary
| Measurement | Aleut | Immigrants from Trinidad and Tobago |
| Minimum | 1.8% | 0.70% |
| Maximum | 75.0% | 12.8% |
| Range | 73.2% | 12.1% |
| Mean | 17.3% | 5.2% |
| Median | 8.5% | 4.8% |
| Interquartile 25% (IQ1) | 5.0% | 3.8% |
| Interquartile 75% (IQ3) | 16.5% | 6.4% |
| Interquartile Range (IQR) | 11.6% | 2.6% |
| Standard Deviation (Sample) | 21.6% | 2.4% |
| Standard Deviation (Population) | 21.0% | 2.4% |
Similar Demographics by Unemployment Among Ages 60 to 64 years
Demographics Similar to Aleuts by Unemployment Among Ages 60 to 64 years
In terms of unemployment among ages 60 to 64 years, the demographic groups most similar to Aleuts are Yuman (6.8%, a difference of 0.010%), Pueblo (6.7%, a difference of 0.54%), Immigrants from Yemen (6.8%, a difference of 0.72%), Tlingit-Haida (6.4%, a difference of 6.1%), and Arapaho (6.3%, a difference of 7.6%).
| Demographics | Rating | Rank | Unemployment Among Ages 60 to 64 years |
| Immigrants | Dominican Republic | 0.0 /100 | #333 | Tragic 6.0% |
| Puerto Ricans | 0.0 /100 | #334 | Tragic 6.1% |
| Vietnamese | 0.0 /100 | #335 | Tragic 6.1% |
| Kiowa | 0.0 /100 | #336 | Tragic 6.2% |
| Navajo | 0.0 /100 | #337 | Tragic 6.3% |
| Arapaho | 0.0 /100 | #338 | Tragic 6.3% |
| Tlingit-Haida | 0.0 /100 | #339 | Tragic 6.4% |
| Pueblo | 0.0 /100 | #340 | Tragic 6.7% |
| Yuman | 0.0 /100 | #341 | Tragic 6.8% |
| Aleuts | 0.0 /100 | #342 | Tragic 6.8% |
| Immigrants | Yemen | 0.0 /100 | #343 | Tragic 6.8% |
| Alaska Natives | 0.0 /100 | #344 | Tragic 7.6% |
| Alaskan Athabascans | 0.0 /100 | #345 | Tragic 8.4% |
| Inupiat | 0.0 /100 | #346 | Tragic 9.6% |
| Yup'ik | 0.0 /100 | #347 | Tragic 11.9% |
Demographics Similar to Immigrants from Trinidad and Tobago by Unemployment Among Ages 60 to 64 years
In terms of unemployment among ages 60 to 64 years, the demographic groups most similar to Immigrants from Trinidad and Tobago are Spanish American (5.3%, a difference of 0.030%), Trinidadian and Tobagonian (5.3%, a difference of 0.060%), Salvadoran (5.3%, a difference of 0.24%), Mexican American Indian (5.3%, a difference of 0.28%), and Hispanic or Latino (5.3%, a difference of 0.32%).
| Demographics | Rating | Rank | Unemployment Among Ages 60 to 64 years |
| Immigrants | Guatemala | 0.0 /100 | #283 | Tragic 5.3% |
| Taiwanese | 0.0 /100 | #284 | Tragic 5.3% |
| West Indians | 0.0 /100 | #285 | Tragic 5.3% |
| Mexican American Indians | 0.0 /100 | #286 | Tragic 5.3% |
| Salvadorans | 0.0 /100 | #287 | Tragic 5.3% |
| Trinidadians and Tobagonians | 0.0 /100 | #288 | Tragic 5.3% |
| Spanish Americans | 0.0 /100 | #289 | Tragic 5.3% |
| Immigrants | Trinidad and Tobago | 0.0 /100 | #290 | Tragic 5.3% |
| Hispanics or Latinos | 0.0 /100 | #291 | Tragic 5.3% |
| Immigrants | Latin America | 0.0 /100 | #292 | Tragic 5.3% |
| Immigrants | Israel | 0.0 /100 | #293 | Tragic 5.3% |
| Blacks/African Americans | 0.0 /100 | #294 | Tragic 5.3% |
| Armenians | 0.0 /100 | #295 | Tragic 5.3% |
| Jamaicans | 0.0 /100 | #296 | Tragic 5.3% |
| Osage | 0.0 /100 | #297 | Tragic 5.4% |