Aleut vs Immigrants from Spain In Labor Force | Age 30-34
COMPARE
Aleut
Immigrants from Spain
In Labor Force | Age 30-34
In Labor Force | Age 30-34 Comparison
Aleuts
Immigrants from Spain
82.6%
IN LABOR FORCE | AGE 30-34
0.0/ 100
METRIC RATING
298th/ 347
METRIC RANK
85.0%
IN LABOR FORCE | AGE 30-34
90.0/ 100
METRIC RATING
130th/ 347
METRIC RANK
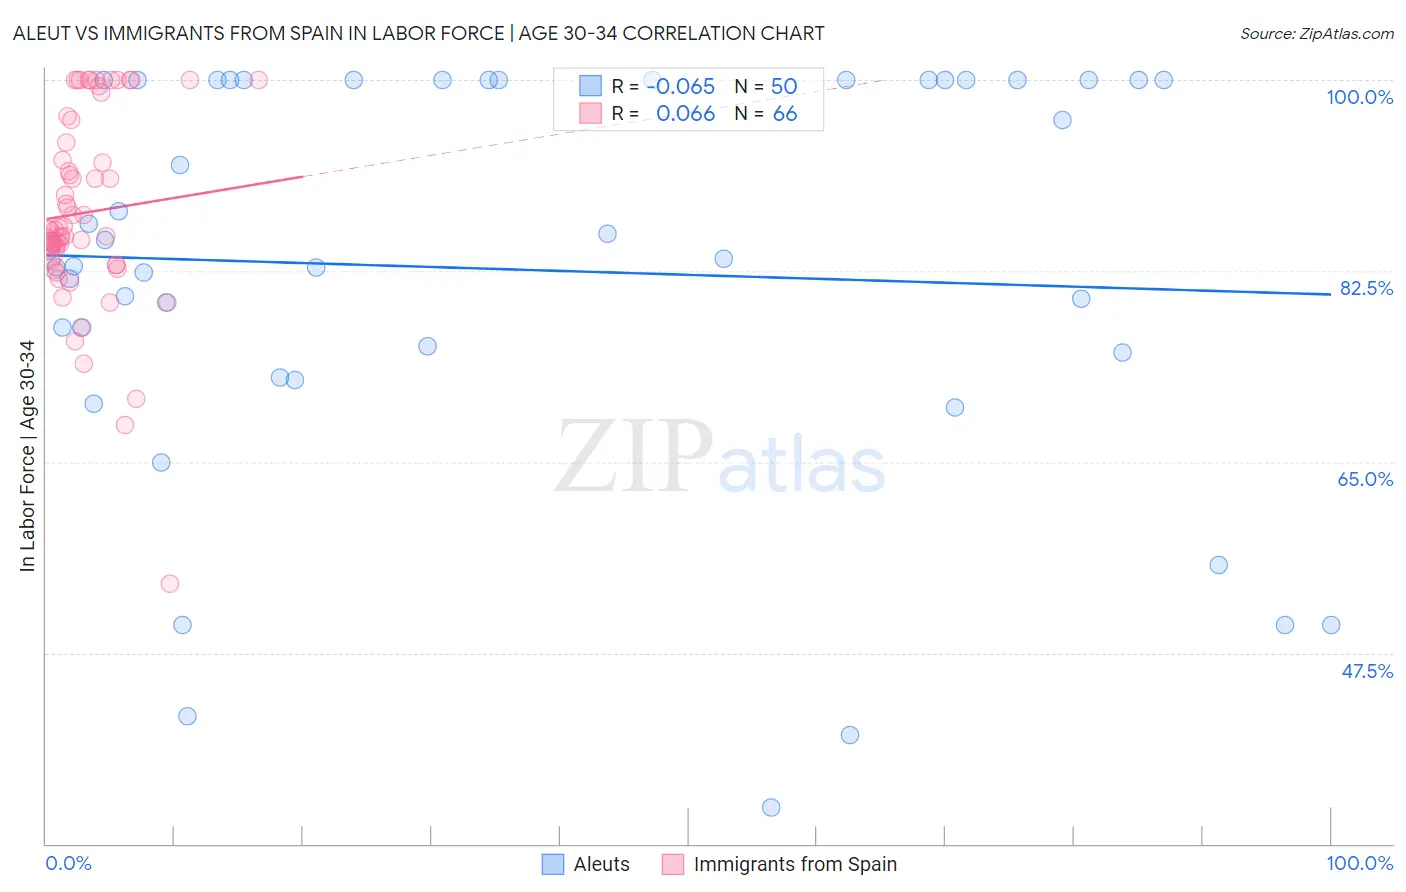
Aleut vs Immigrants from Spain In Labor Force | Age 30-34 Correlation Chart
The statistical analysis conducted on geographies consisting of 61,771,589 people shows a slight negative correlation between the proportion of Aleuts and labor force participation rate among population between the ages 30 and 34 in the United States with a correlation coefficient (R) of -0.065 and weighted average of 82.6%. Similarly, the statistical analysis conducted on geographies consisting of 239,607,955 people shows a slight positive correlation between the proportion of Immigrants from Spain and labor force participation rate among population between the ages 30 and 34 in the United States with a correlation coefficient (R) of 0.066 and weighted average of 85.0%, a difference of 2.9%.
In Labor Force | Age 30-34 Correlation Summary
| Measurement | Aleut | Immigrants from Spain |
| Minimum | 33.3% | 53.8% |
| Maximum | 100.0% | 100.0% |
| Range | 66.7% | 46.2% |
| Mean | 82.6% | 87.8% |
| Median | 84.1% | 86.3% |
| Interquartile 25% (IQ1) | 75.0% | 83.4% |
| Interquartile 75% (IQ3) | 100.0% | 94.3% |
| Interquartile Range (IQR) | 25.0% | 10.9% |
| Standard Deviation (Sample) | 18.4% | 8.9% |
| Standard Deviation (Population) | 18.2% | 8.8% |
Similar Demographics by In Labor Force | Age 30-34
Demographics Similar to Aleuts by In Labor Force | Age 30-34
In terms of in labor force | age 30-34, the demographic groups most similar to Aleuts are Comanche (82.6%, a difference of 0.0%), Chippewa (82.6%, a difference of 0.010%), Pennsylvania German (82.6%, a difference of 0.030%), Immigrants from Central America (82.5%, a difference of 0.13%), and American (82.7%, a difference of 0.15%).
| Demographics | Rating | Rank | In Labor Force | Age 30-34 |
| Potawatomi | 0.0 /100 | #291 | Tragic 82.8% |
| Blacks/African Americans | 0.0 /100 | #292 | Tragic 82.8% |
| Nepalese | 0.0 /100 | #293 | Tragic 82.7% |
| Americans | 0.0 /100 | #294 | Tragic 82.7% |
| Pennsylvania Germans | 0.0 /100 | #295 | Tragic 82.6% |
| Chippewa | 0.0 /100 | #296 | Tragic 82.6% |
| Comanche | 0.0 /100 | #297 | Tragic 82.6% |
| Aleuts | 0.0 /100 | #298 | Tragic 82.6% |
| Immigrants | Central America | 0.0 /100 | #299 | Tragic 82.5% |
| Hmong | 0.0 /100 | #300 | Tragic 82.4% |
| Hispanics or Latinos | 0.0 /100 | #301 | Tragic 82.4% |
| Ottawa | 0.0 /100 | #302 | Tragic 82.4% |
| Immigrants | Micronesia | 0.0 /100 | #303 | Tragic 82.4% |
| Tlingit-Haida | 0.0 /100 | #304 | Tragic 82.3% |
| Osage | 0.0 /100 | #305 | Tragic 82.3% |
Demographics Similar to Immigrants from Spain by In Labor Force | Age 30-34
In terms of in labor force | age 30-34, the demographic groups most similar to Immigrants from Spain are Immigrants from Western Africa (85.0%, a difference of 0.0%), Slavic (85.0%, a difference of 0.010%), Immigrants from Argentina (85.0%, a difference of 0.010%), Chinese (85.0%, a difference of 0.010%), and Immigrants from Israel (85.0%, a difference of 0.010%).
| Demographics | Rating | Rank | In Labor Force | Age 30-34 |
| Armenians | 92.2 /100 | #123 | Exceptional 85.0% |
| Australians | 92.0 /100 | #124 | Exceptional 85.0% |
| Immigrants | Jordan | 91.5 /100 | #125 | Exceptional 85.0% |
| Austrians | 90.9 /100 | #126 | Exceptional 85.0% |
| Slavs | 90.7 /100 | #127 | Exceptional 85.0% |
| Immigrants | Argentina | 90.6 /100 | #128 | Exceptional 85.0% |
| Immigrants | Western Africa | 90.2 /100 | #129 | Exceptional 85.0% |
| Immigrants | Spain | 90.0 /100 | #130 | Exceptional 85.0% |
| Chinese | 89.6 /100 | #131 | Excellent 85.0% |
| Immigrants | Israel | 89.5 /100 | #132 | Excellent 85.0% |
| New Zealanders | 89.5 /100 | #133 | Excellent 85.0% |
| Immigrants | Chile | 89.2 /100 | #134 | Excellent 85.0% |
| Immigrants | Asia | 88.9 /100 | #135 | Excellent 85.0% |
| Jordanians | 88.6 /100 | #136 | Excellent 85.0% |
| South Africans | 88.0 /100 | #137 | Excellent 85.0% |