Aleut vs Immigrants from Nicaragua 3rd Grade
COMPARE
Aleut
Immigrants from Nicaragua
3rd Grade
3rd Grade Comparison
Aleuts
Immigrants from Nicaragua
98.5%
3RD GRADE
100.0/ 100
METRIC RATING
26th/ 347
METRIC RANK
96.5%
3RD GRADE
0.0/ 100
METRIC RATING
320th/ 347
METRIC RANK
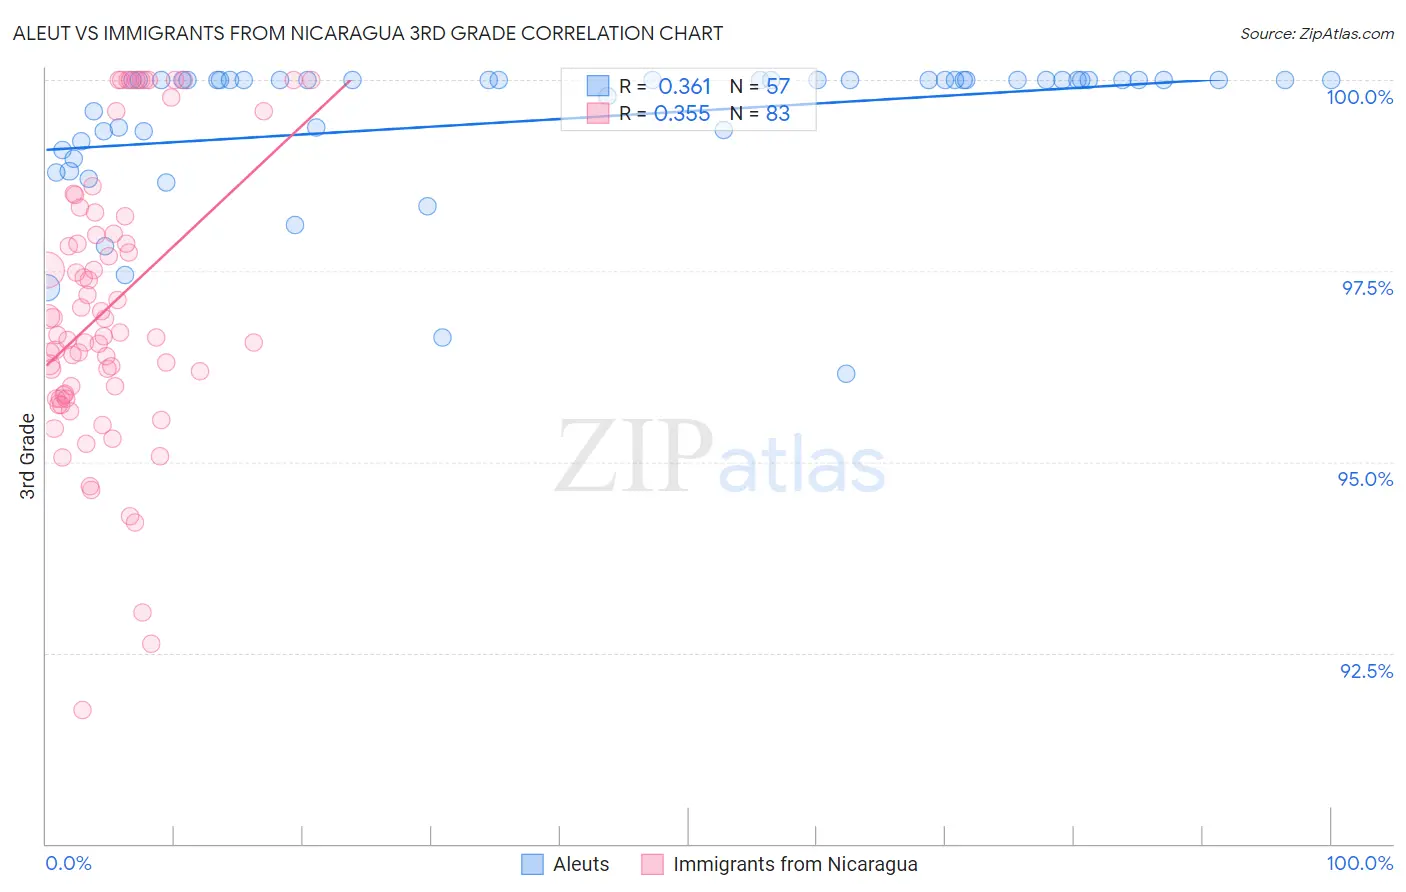
Aleut vs Immigrants from Nicaragua 3rd Grade Correlation Chart
The statistical analysis conducted on geographies consisting of 61,781,033 people shows a mild positive correlation between the proportion of Aleuts and percentage of population with at least 3rd grade education in the United States with a correlation coefficient (R) of 0.361 and weighted average of 98.5%. Similarly, the statistical analysis conducted on geographies consisting of 236,332,861 people shows a mild positive correlation between the proportion of Immigrants from Nicaragua and percentage of population with at least 3rd grade education in the United States with a correlation coefficient (R) of 0.355 and weighted average of 96.5%, a difference of 2.0%.
3rd Grade Correlation Summary
| Measurement | Aleut | Immigrants from Nicaragua |
| Minimum | 96.2% | 91.7% |
| Maximum | 100.0% | 100.0% |
| Range | 3.8% | 8.3% |
| Mean | 99.5% | 97.0% |
| Median | 100.0% | 96.7% |
| Interquartile 25% (IQ1) | 99.3% | 95.9% |
| Interquartile 75% (IQ3) | 100.0% | 98.2% |
| Interquartile Range (IQR) | 0.74% | 2.3% |
| Standard Deviation (Sample) | 0.91% | 1.8% |
| Standard Deviation (Population) | 0.91% | 1.8% |
Similar Demographics by 3rd Grade
Demographics Similar to Aleuts by 3rd Grade
In terms of 3rd grade, the demographic groups most similar to Aleuts are Sioux (98.5%, a difference of 0.010%), Danish (98.5%, a difference of 0.010%), Scotch-Irish (98.5%, a difference of 0.010%), Croatian (98.5%, a difference of 0.010%), and Polish (98.5%, a difference of 0.020%).
| Demographics | Rating | Rank | 3rd Grade |
| Poles | 100.0 /100 | #19 | Exceptional 98.5% |
| Pennsylvania Germans | 100.0 /100 | #20 | Exceptional 98.5% |
| Lithuanians | 100.0 /100 | #21 | Exceptional 98.5% |
| Finns | 100.0 /100 | #22 | Exceptional 98.5% |
| Sioux | 100.0 /100 | #23 | Exceptional 98.5% |
| Danes | 100.0 /100 | #24 | Exceptional 98.5% |
| Scotch-Irish | 100.0 /100 | #25 | Exceptional 98.5% |
| Aleuts | 100.0 /100 | #26 | Exceptional 98.5% |
| Croatians | 100.0 /100 | #27 | Exceptional 98.5% |
| French | 100.0 /100 | #28 | Exceptional 98.4% |
| French Canadians | 100.0 /100 | #29 | Exceptional 98.4% |
| Europeans | 100.0 /100 | #30 | Exceptional 98.4% |
| Czechs | 100.0 /100 | #31 | Exceptional 98.4% |
| Scandinavians | 100.0 /100 | #32 | Exceptional 98.4% |
| Chinese | 100.0 /100 | #33 | Exceptional 98.4% |
Demographics Similar to Immigrants from Nicaragua by 3rd Grade
In terms of 3rd grade, the demographic groups most similar to Immigrants from Nicaragua are Indonesian (96.5%, a difference of 0.0%), Immigrants from Belize (96.5%, a difference of 0.0%), Vietnamese (96.5%, a difference of 0.010%), Hispanic or Latino (96.5%, a difference of 0.020%), and Honduran (96.5%, a difference of 0.020%).
| Demographics | Rating | Rank | 3rd Grade |
| Immigrants | Ecuador | 0.0 /100 | #313 | Tragic 96.6% |
| Belizeans | 0.0 /100 | #314 | Tragic 96.6% |
| Immigrants | Azores | 0.0 /100 | #315 | Tragic 96.6% |
| Immigrants | Burma/Myanmar | 0.0 /100 | #316 | Tragic 96.6% |
| Immigrants | Bangladesh | 0.0 /100 | #317 | Tragic 96.6% |
| Hispanics or Latinos | 0.0 /100 | #318 | Tragic 96.5% |
| Vietnamese | 0.0 /100 | #319 | Tragic 96.5% |
| Immigrants | Nicaragua | 0.0 /100 | #320 | Tragic 96.5% |
| Indonesians | 0.0 /100 | #321 | Tragic 96.5% |
| Immigrants | Belize | 0.0 /100 | #322 | Tragic 96.5% |
| Hondurans | 0.0 /100 | #323 | Tragic 96.5% |
| Dominicans | 0.0 /100 | #324 | Tragic 96.4% |
| Mexican American Indians | 0.0 /100 | #325 | Tragic 96.4% |
| Immigrants | Vietnam | 0.0 /100 | #326 | Tragic 96.4% |
| Japanese | 0.0 /100 | #327 | Tragic 96.4% |