Albanian vs Immigrants from Netherlands Seniors Poverty Over the Age of 65
COMPARE
Albanian
Immigrants from Netherlands
Seniors Poverty Over the Age of 65
Seniors Poverty Over the Age of 65 Comparison
Albanians
Immigrants from Netherlands
11.2%
SENIORS POVERTY OVER THE AGE OF 65
24.4/ 100
METRIC RATING
197th/ 347
METRIC RANK
9.9%
SENIORS POVERTY OVER THE AGE OF 65
98.7/ 100
METRIC RATING
66th/ 347
METRIC RANK
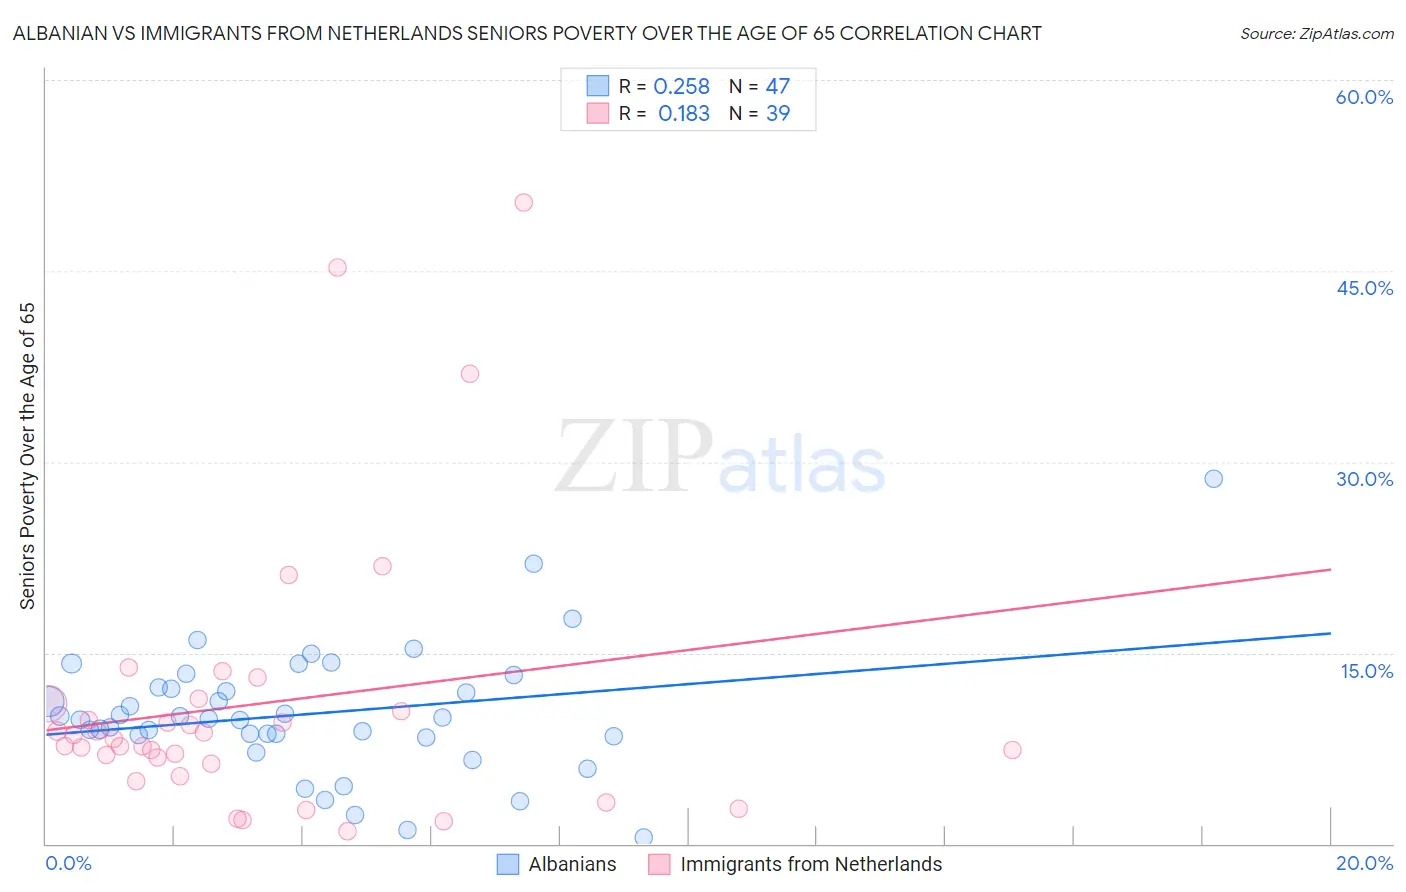
Albanian vs Immigrants from Netherlands Seniors Poverty Over the Age of 65 Correlation Chart
The statistical analysis conducted on geographies consisting of 192,842,958 people shows a weak positive correlation between the proportion of Albanians and poverty level among seniors over the age of 65 in the United States with a correlation coefficient (R) of 0.258 and weighted average of 11.2%. Similarly, the statistical analysis conducted on geographies consisting of 237,542,922 people shows a poor positive correlation between the proportion of Immigrants from Netherlands and poverty level among seniors over the age of 65 in the United States with a correlation coefficient (R) of 0.183 and weighted average of 9.9%, a difference of 13.3%.
Seniors Poverty Over the Age of 65 Correlation Summary
| Measurement | Albanian | Immigrants from Netherlands |
| Minimum | 0.44% | 1.0% |
| Maximum | 28.7% | 50.3% |
| Range | 28.2% | 49.3% |
| Mean | 10.2% | 11.0% |
| Median | 9.8% | 8.2% |
| Interquartile 25% (IQ1) | 8.4% | 6.3% |
| Interquartile 75% (IQ3) | 12.3% | 11.0% |
| Interquartile Range (IQR) | 3.8% | 4.8% |
| Standard Deviation (Sample) | 5.0% | 10.8% |
| Standard Deviation (Population) | 5.0% | 10.7% |
Similar Demographics by Seniors Poverty Over the Age of 65
Demographics Similar to Albanians by Seniors Poverty Over the Age of 65
In terms of seniors poverty over the age of 65, the demographic groups most similar to Albanians are Bangladeshi (11.2%, a difference of 0.090%), Immigrants from Vietnam (11.2%, a difference of 0.26%), Immigrants from Burma/Myanmar (11.3%, a difference of 0.38%), Chilean (11.2%, a difference of 0.39%), and Immigrants from Israel (11.3%, a difference of 0.52%).
| Demographics | Rating | Rank | Seniors Poverty Over the Age of 65 |
| Indians (Asian) | 34.2 /100 | #190 | Fair 11.1% |
| Immigrants | Uganda | 32.2 /100 | #191 | Fair 11.1% |
| Immigrants | Southern Europe | 30.1 /100 | #192 | Fair 11.1% |
| Taiwanese | 29.2 /100 | #193 | Fair 11.2% |
| Chileans | 27.8 /100 | #194 | Fair 11.2% |
| Immigrants | Vietnam | 26.6 /100 | #195 | Fair 11.2% |
| Bangladeshis | 25.2 /100 | #196 | Fair 11.2% |
| Albanians | 24.4 /100 | #197 | Fair 11.2% |
| Immigrants | Burma/Myanmar | 21.3 /100 | #198 | Fair 11.3% |
| Immigrants | Israel | 20.3 /100 | #199 | Fair 11.3% |
| Alsatians | 20.1 /100 | #200 | Fair 11.3% |
| Immigrants | Brazil | 17.8 /100 | #201 | Poor 11.3% |
| Costa Ricans | 17.0 /100 | #202 | Poor 11.3% |
| Immigrants | Zaire | 16.9 /100 | #203 | Poor 11.3% |
| Israelis | 16.5 /100 | #204 | Poor 11.3% |
Demographics Similar to Immigrants from Netherlands by Seniors Poverty Over the Age of 65
In terms of seniors poverty over the age of 65, the demographic groups most similar to Immigrants from Netherlands are Pennsylvania German (9.9%, a difference of 0.050%), Immigrants from Austria (9.9%, a difference of 0.10%), Canadian (9.9%, a difference of 0.32%), Immigrants from North America (9.9%, a difference of 0.33%), and Macedonian (9.9%, a difference of 0.38%).
| Demographics | Rating | Rank | Seniors Poverty Over the Age of 65 |
| Immigrants | Canada | 99.0 /100 | #59 | Exceptional 9.8% |
| Celtics | 99.0 /100 | #60 | Exceptional 9.8% |
| Iranians | 98.9 /100 | #61 | Exceptional 9.8% |
| French Canadians | 98.9 /100 | #62 | Exceptional 9.8% |
| Macedonians | 98.8 /100 | #63 | Exceptional 9.9% |
| Immigrants | North America | 98.8 /100 | #64 | Exceptional 9.9% |
| Pennsylvania Germans | 98.7 /100 | #65 | Exceptional 9.9% |
| Immigrants | Netherlands | 98.7 /100 | #66 | Exceptional 9.9% |
| Immigrants | Austria | 98.6 /100 | #67 | Exceptional 9.9% |
| Canadians | 98.5 /100 | #68 | Exceptional 9.9% |
| Australians | 98.4 /100 | #69 | Exceptional 9.9% |
| Samoans | 98.0 /100 | #70 | Exceptional 10.0% |
| Yugoslavians | 97.9 /100 | #71 | Exceptional 10.0% |
| Palestinians | 97.9 /100 | #72 | Exceptional 10.0% |
| Russians | 97.9 /100 | #73 | Exceptional 10.0% |