Albanian vs Hungarian Seniors Poverty Over the Age of 65
COMPARE
Albanian
Hungarian
Seniors Poverty Over the Age of 65
Seniors Poverty Over the Age of 65 Comparison
Albanians
Hungarians
11.2%
SENIORS POVERTY OVER THE AGE OF 65
24.4/ 100
METRIC RATING
197th/ 347
METRIC RANK
9.7%
SENIORS POVERTY OVER THE AGE OF 65
99.4/ 100
METRIC RATING
50th/ 347
METRIC RANK
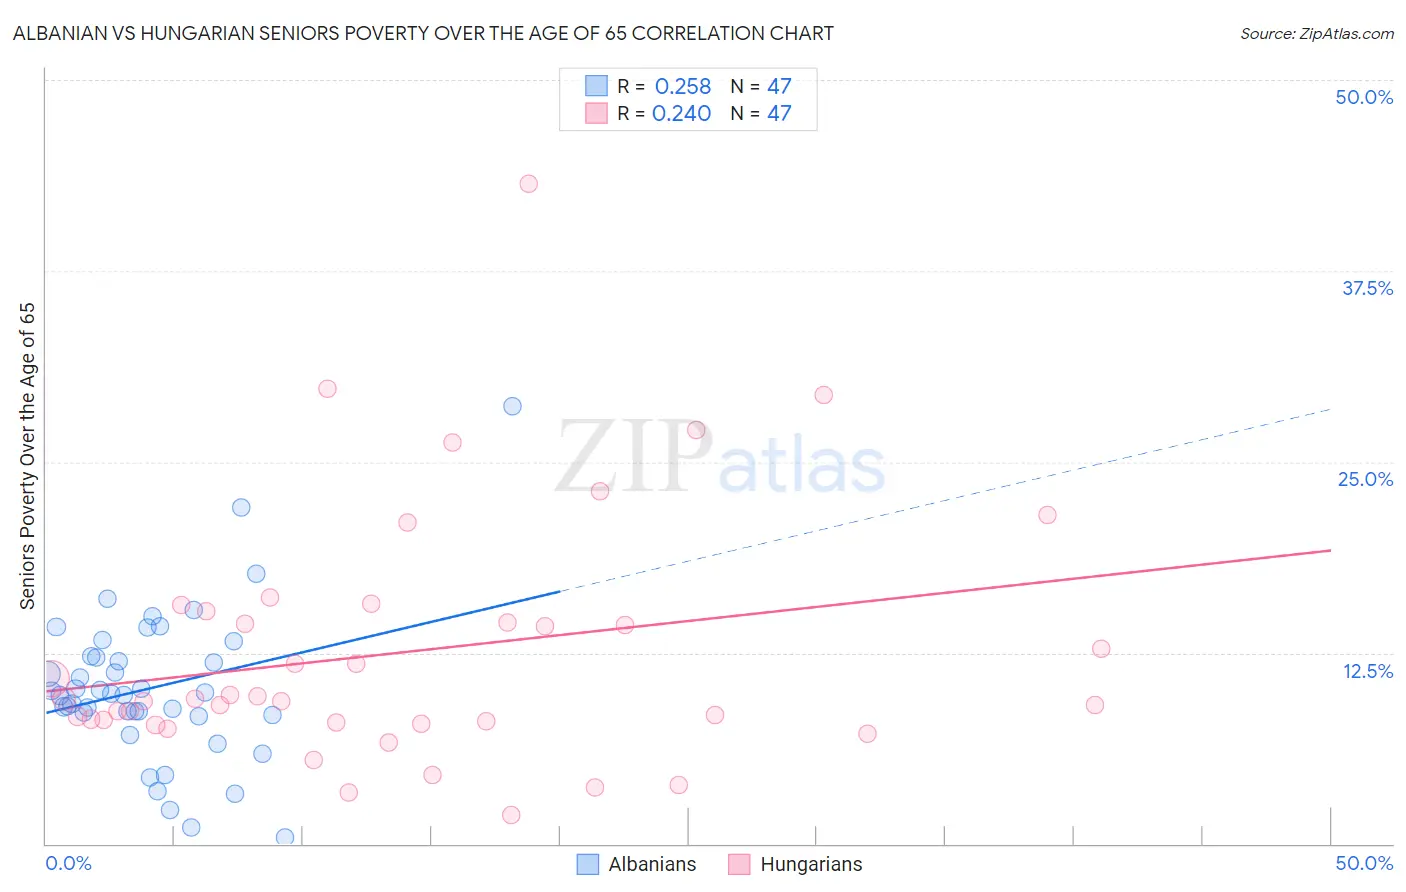
Albanian vs Hungarian Seniors Poverty Over the Age of 65 Correlation Chart
The statistical analysis conducted on geographies consisting of 192,842,958 people shows a weak positive correlation between the proportion of Albanians and poverty level among seniors over the age of 65 in the United States with a correlation coefficient (R) of 0.258 and weighted average of 11.2%. Similarly, the statistical analysis conducted on geographies consisting of 483,559,616 people shows a weak positive correlation between the proportion of Hungarians and poverty level among seniors over the age of 65 in the United States with a correlation coefficient (R) of 0.240 and weighted average of 9.7%, a difference of 15.6%.
Seniors Poverty Over the Age of 65 Correlation Summary
| Measurement | Albanian | Hungarian |
| Minimum | 0.44% | 1.9% |
| Maximum | 28.7% | 43.2% |
| Range | 28.2% | 41.3% |
| Mean | 10.2% | 12.6% |
| Median | 9.8% | 9.5% |
| Interquartile 25% (IQ1) | 8.4% | 7.9% |
| Interquartile 75% (IQ3) | 12.3% | 15.2% |
| Interquartile Range (IQR) | 3.8% | 7.3% |
| Standard Deviation (Sample) | 5.0% | 8.2% |
| Standard Deviation (Population) | 5.0% | 8.1% |
Similar Demographics by Seniors Poverty Over the Age of 65
Demographics Similar to Albanians by Seniors Poverty Over the Age of 65
In terms of seniors poverty over the age of 65, the demographic groups most similar to Albanians are Bangladeshi (11.2%, a difference of 0.090%), Immigrants from Vietnam (11.2%, a difference of 0.26%), Immigrants from Burma/Myanmar (11.3%, a difference of 0.38%), Chilean (11.2%, a difference of 0.39%), and Immigrants from Israel (11.3%, a difference of 0.52%).
| Demographics | Rating | Rank | Seniors Poverty Over the Age of 65 |
| Indians (Asian) | 34.2 /100 | #190 | Fair 11.1% |
| Immigrants | Uganda | 32.2 /100 | #191 | Fair 11.1% |
| Immigrants | Southern Europe | 30.1 /100 | #192 | Fair 11.1% |
| Taiwanese | 29.2 /100 | #193 | Fair 11.2% |
| Chileans | 27.8 /100 | #194 | Fair 11.2% |
| Immigrants | Vietnam | 26.6 /100 | #195 | Fair 11.2% |
| Bangladeshis | 25.2 /100 | #196 | Fair 11.2% |
| Albanians | 24.4 /100 | #197 | Fair 11.2% |
| Immigrants | Burma/Myanmar | 21.3 /100 | #198 | Fair 11.3% |
| Immigrants | Israel | 20.3 /100 | #199 | Fair 11.3% |
| Alsatians | 20.1 /100 | #200 | Fair 11.3% |
| Immigrants | Brazil | 17.8 /100 | #201 | Poor 11.3% |
| Costa Ricans | 17.0 /100 | #202 | Poor 11.3% |
| Immigrants | Zaire | 16.9 /100 | #203 | Poor 11.3% |
| Israelis | 16.5 /100 | #204 | Poor 11.3% |
Demographics Similar to Hungarians by Seniors Poverty Over the Age of 65
In terms of seniors poverty over the age of 65, the demographic groups most similar to Hungarians are Immigrants from Lithuania (9.7%, a difference of 0.22%), French (9.7%, a difference of 0.28%), Immigrants from South Central Asia (9.7%, a difference of 0.39%), Immigrants from Taiwan (9.7%, a difference of 0.40%), and Carpatho Rusyn (9.7%, a difference of 0.48%).
| Demographics | Rating | Rank | Seniors Poverty Over the Age of 65 |
| Eastern Europeans | 99.6 /100 | #43 | Exceptional 9.6% |
| Austrians | 99.5 /100 | #44 | Exceptional 9.6% |
| Estonians | 99.5 /100 | #45 | Exceptional 9.6% |
| Immigrants | Taiwan | 99.5 /100 | #46 | Exceptional 9.7% |
| Immigrants | South Central Asia | 99.5 /100 | #47 | Exceptional 9.7% |
| French | 99.5 /100 | #48 | Exceptional 9.7% |
| Immigrants | Lithuania | 99.4 /100 | #49 | Exceptional 9.7% |
| Hungarians | 99.4 /100 | #50 | Exceptional 9.7% |
| Carpatho Rusyns | 99.3 /100 | #51 | Exceptional 9.7% |
| Filipinos | 99.3 /100 | #52 | Exceptional 9.7% |
| Slavs | 99.2 /100 | #53 | Exceptional 9.8% |
| Immigrants | Northern Europe | 99.2 /100 | #54 | Exceptional 9.8% |
| Afghans | 99.2 /100 | #55 | Exceptional 9.8% |
| Immigrants | England | 99.1 /100 | #56 | Exceptional 9.8% |
| Bolivians | 99.1 /100 | #57 | Exceptional 9.8% |