Immigrants from Jamaica vs Immigrants from Burma/Myanmar Child Poverty Among Boys Under 16
COMPARE
Immigrants from Jamaica
Immigrants from Burma/Myanmar
Child Poverty Among Boys Under 16
Child Poverty Among Boys Under 16 Comparison
Immigrants from Jamaica
Immigrants from Burma/Myanmar
20.1%
CHILD POVERTY AMONG BOYS UNDER 16
0.0/ 100
METRIC RATING
283rd/ 347
METRIC RANK
19.2%
CHILD POVERTY AMONG BOYS UNDER 16
0.2/ 100
METRIC RATING
250th/ 347
METRIC RANK
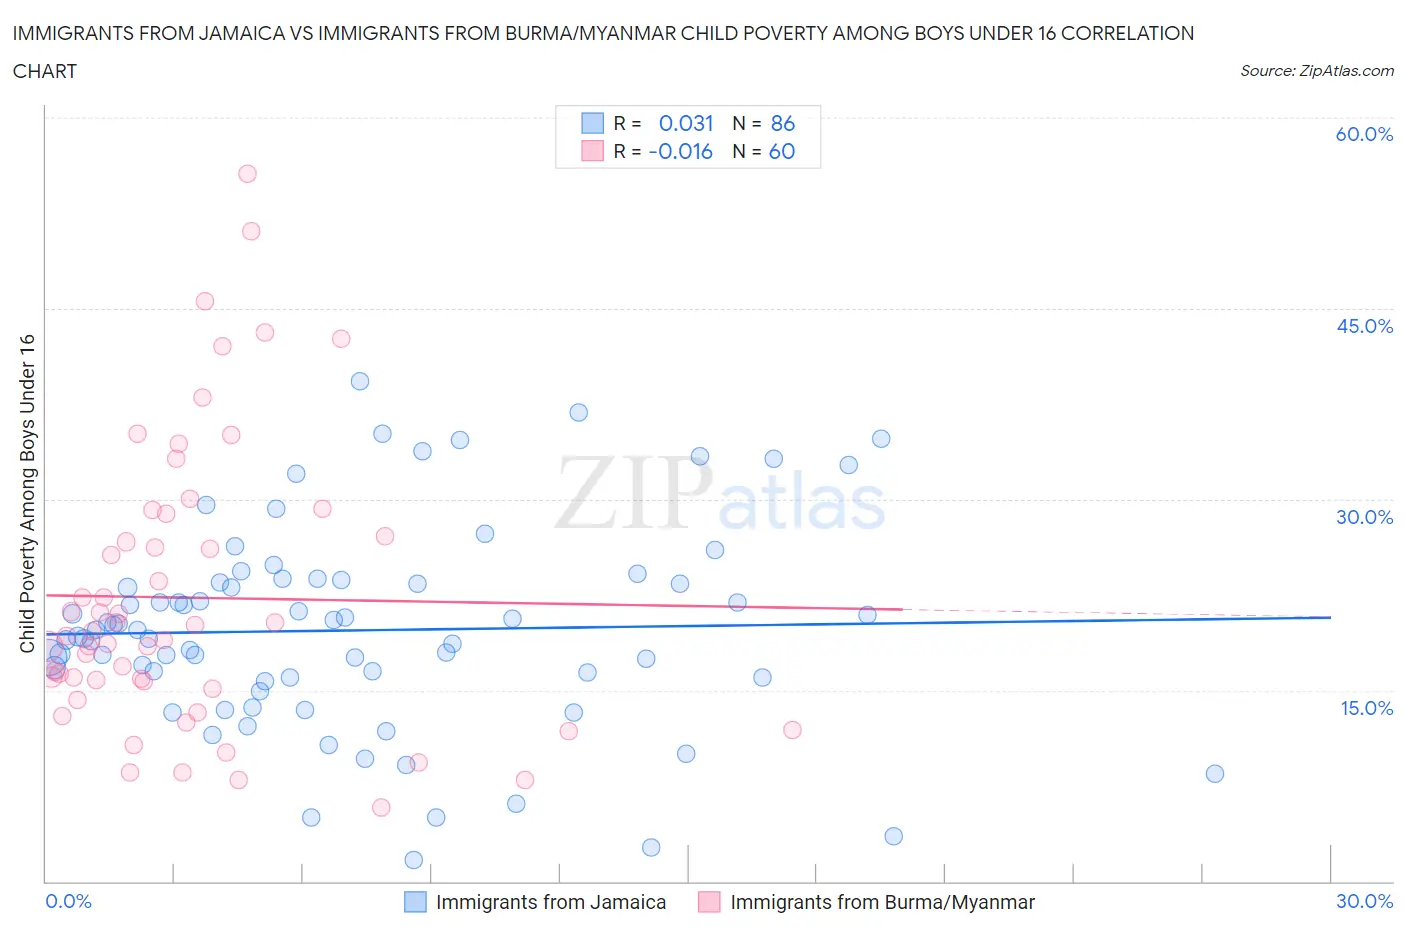
Immigrants from Jamaica vs Immigrants from Burma/Myanmar Child Poverty Among Boys Under 16 Correlation Chart
The statistical analysis conducted on geographies consisting of 298,141,614 people shows no correlation between the proportion of Immigrants from Jamaica and poverty level among boys under the age of 16 in the United States with a correlation coefficient (R) of 0.031 and weighted average of 20.1%. Similarly, the statistical analysis conducted on geographies consisting of 171,312,053 people shows no correlation between the proportion of Immigrants from Burma/Myanmar and poverty level among boys under the age of 16 in the United States with a correlation coefficient (R) of -0.016 and weighted average of 19.2%, a difference of 4.6%.
Child Poverty Among Boys Under 16 Correlation Summary
| Measurement | Immigrants from Jamaica | Immigrants from Burma/Myanmar |
| Minimum | 1.7% | 5.8% |
| Maximum | 39.3% | 55.6% |
| Range | 37.6% | 49.8% |
| Mean | 19.7% | 22.3% |
| Median | 19.5% | 19.5% |
| Interquartile 25% (IQ1) | 16.0% | 15.4% |
| Interquartile 75% (IQ3) | 23.5% | 28.0% |
| Interquartile Range (IQR) | 7.5% | 12.6% |
| Standard Deviation (Sample) | 7.9% | 11.2% |
| Standard Deviation (Population) | 7.9% | 11.1% |
Similar Demographics by Child Poverty Among Boys Under 16
Demographics Similar to Immigrants from Jamaica by Child Poverty Among Boys Under 16
In terms of child poverty among boys under 16, the demographic groups most similar to Immigrants from Jamaica are Comanche (20.1%, a difference of 0.13%), Immigrants from Zaire (20.1%, a difference of 0.18%), Barbadian (20.2%, a difference of 0.23%), Central American (20.1%, a difference of 0.24%), and Bangladeshi (20.0%, a difference of 0.36%).
| Demographics | Rating | Rank | Child Poverty Among Boys Under 16 |
| Sub-Saharan Africans | 0.0 /100 | #276 | Tragic 20.0% |
| Immigrants | Barbados | 0.0 /100 | #277 | Tragic 20.0% |
| Immigrants | West Indies | 0.0 /100 | #278 | Tragic 20.0% |
| Bangladeshis | 0.0 /100 | #279 | Tragic 20.0% |
| Central Americans | 0.0 /100 | #280 | Tragic 20.1% |
| Immigrants | Zaire | 0.0 /100 | #281 | Tragic 20.1% |
| Comanche | 0.0 /100 | #282 | Tragic 20.1% |
| Immigrants | Jamaica | 0.0 /100 | #283 | Tragic 20.1% |
| Barbadians | 0.0 /100 | #284 | Tragic 20.2% |
| Arapaho | 0.0 /100 | #285 | Tragic 20.2% |
| West Indians | 0.0 /100 | #286 | Tragic 20.3% |
| Immigrants | Belize | 0.0 /100 | #287 | Tragic 20.3% |
| Immigrants | St. Vincent and the Grenadines | 0.0 /100 | #288 | Tragic 20.3% |
| Blackfeet | 0.0 /100 | #289 | Tragic 20.4% |
| Senegalese | 0.0 /100 | #290 | Tragic 20.6% |
Demographics Similar to Immigrants from Burma/Myanmar by Child Poverty Among Boys Under 16
In terms of child poverty among boys under 16, the demographic groups most similar to Immigrants from Burma/Myanmar are French American Indian (19.2%, a difference of 0.030%), Immigrants from Western Africa (19.3%, a difference of 0.26%), Liberian (19.3%, a difference of 0.33%), Trinidadian and Tobagonian (19.3%, a difference of 0.60%), and Ecuadorian (19.3%, a difference of 0.60%).
| Demographics | Rating | Rank | Child Poverty Among Boys Under 16 |
| Immigrants | Azores | 0.4 /100 | #243 | Tragic 18.9% |
| Immigrants | Middle Africa | 0.4 /100 | #244 | Tragic 18.9% |
| Cree | 0.4 /100 | #245 | Tragic 19.0% |
| Immigrants | Nicaragua | 0.4 /100 | #246 | Tragic 19.0% |
| Immigrants | Trinidad and Tobago | 0.3 /100 | #247 | Tragic 19.0% |
| Salvadorans | 0.3 /100 | #248 | Tragic 19.0% |
| Alsatians | 0.3 /100 | #249 | Tragic 19.1% |
| Immigrants | Burma/Myanmar | 0.2 /100 | #250 | Tragic 19.2% |
| French American Indians | 0.2 /100 | #251 | Tragic 19.2% |
| Immigrants | Western Africa | 0.2 /100 | #252 | Tragic 19.3% |
| Liberians | 0.2 /100 | #253 | Tragic 19.3% |
| Trinidadians and Tobagonians | 0.2 /100 | #254 | Tragic 19.3% |
| Ecuadorians | 0.2 /100 | #255 | Tragic 19.3% |
| Immigrants | Liberia | 0.2 /100 | #256 | Tragic 19.3% |
| Mexican American Indians | 0.2 /100 | #257 | Tragic 19.4% |