Alaskan Athabascan vs Syrian In Labor Force | Age 30-34
COMPARE
Alaskan Athabascan
Syrian
In Labor Force | Age 30-34
In Labor Force | Age 30-34 Comparison
Alaskan Athabascans
Syrians
81.7%
IN LABOR FORCE | AGE 30-34
0.0/ 100
METRIC RATING
314th/ 347
METRIC RANK
84.8%
IN LABOR FORCE | AGE 30-34
70.1/ 100
METRIC RATING
153rd/ 347
METRIC RANK
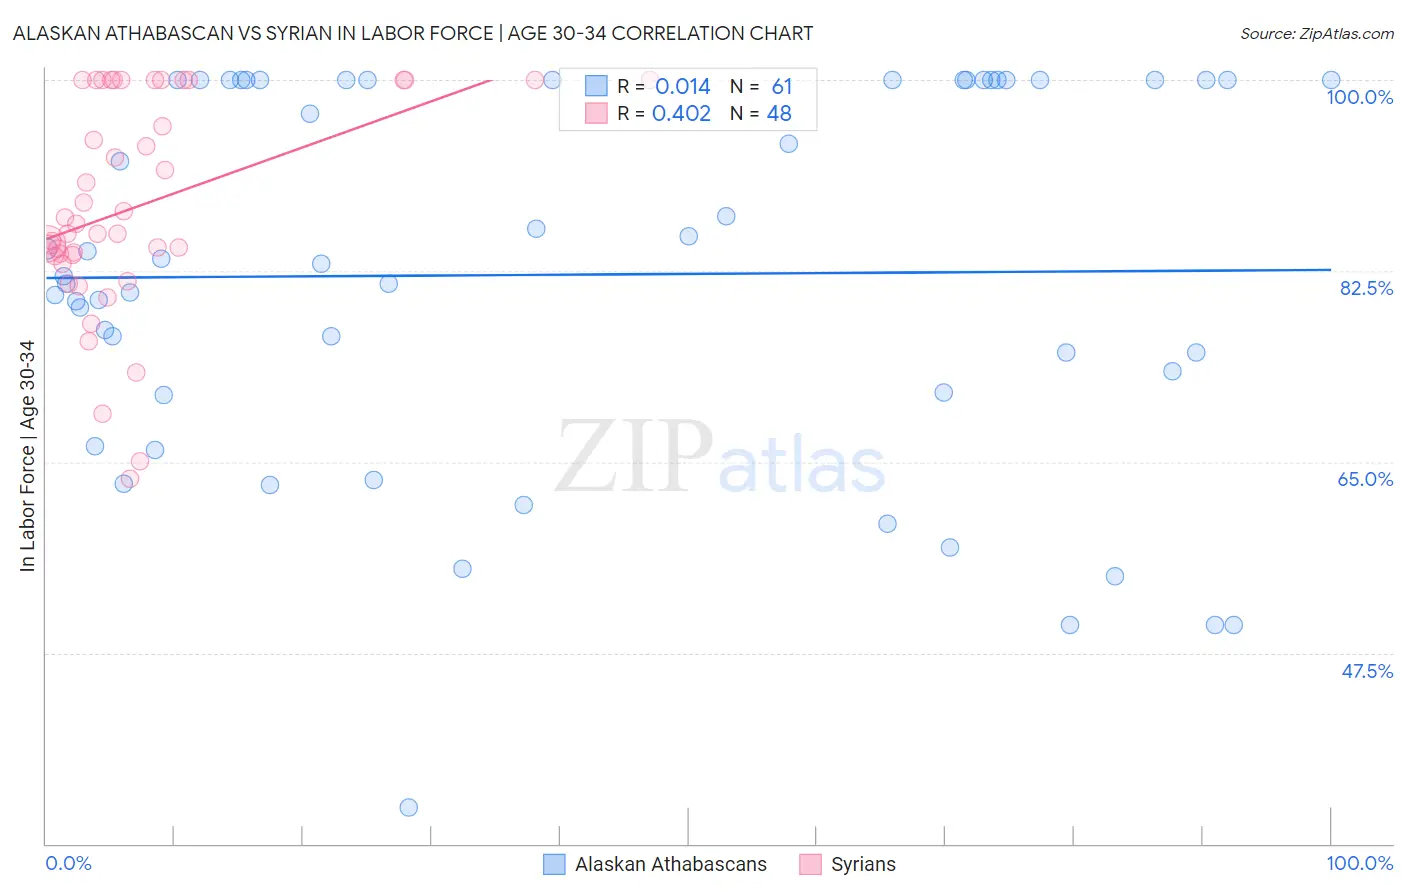
Alaskan Athabascan vs Syrian In Labor Force | Age 30-34 Correlation Chart
The statistical analysis conducted on geographies consisting of 45,811,893 people shows no correlation between the proportion of Alaskan Athabascans and labor force participation rate among population between the ages 30 and 34 in the United States with a correlation coefficient (R) of 0.014 and weighted average of 81.7%. Similarly, the statistical analysis conducted on geographies consisting of 266,193,214 people shows a moderate positive correlation between the proportion of Syrians and labor force participation rate among population between the ages 30 and 34 in the United States with a correlation coefficient (R) of 0.402 and weighted average of 84.8%, a difference of 3.8%.
In Labor Force | Age 30-34 Correlation Summary
| Measurement | Alaskan Athabascan | Syrian |
| Minimum | 33.3% | 63.5% |
| Maximum | 100.0% | 100.0% |
| Range | 66.7% | 36.5% |
| Mean | 82.2% | 88.4% |
| Median | 83.2% | 86.4% |
| Interquartile 25% (IQ1) | 71.3% | 83.9% |
| Interquartile 75% (IQ3) | 100.0% | 100.0% |
| Interquartile Range (IQR) | 28.7% | 16.1% |
| Standard Deviation (Sample) | 17.3% | 9.8% |
| Standard Deviation (Population) | 17.2% | 9.7% |
Similar Demographics by In Labor Force | Age 30-34
Demographics Similar to Alaskan Athabascans by In Labor Force | Age 30-34
In terms of in labor force | age 30-34, the demographic groups most similar to Alaskan Athabascans are Cherokee (81.6%, a difference of 0.10%), Iroquois (81.9%, a difference of 0.25%), Immigrants from the Azores (81.5%, a difference of 0.25%), Arapaho (81.5%, a difference of 0.26%), and Chickasaw (81.9%, a difference of 0.27%).
| Demographics | Rating | Rank | In Labor Force | Age 30-34 |
| Menominee | 0.0 /100 | #307 | Tragic 82.2% |
| Puget Sound Salish | 0.0 /100 | #308 | Tragic 82.1% |
| Immigrants | Mexico | 0.0 /100 | #309 | Tragic 82.0% |
| Cajuns | 0.0 /100 | #310 | Tragic 82.0% |
| Chickasaw | 0.0 /100 | #311 | Tragic 81.9% |
| Mexicans | 0.0 /100 | #312 | Tragic 81.9% |
| Iroquois | 0.0 /100 | #313 | Tragic 81.9% |
| Alaskan Athabascans | 0.0 /100 | #314 | Tragic 81.7% |
| Cherokee | 0.0 /100 | #315 | Tragic 81.6% |
| Immigrants | Azores | 0.0 /100 | #316 | Tragic 81.5% |
| Arapaho | 0.0 /100 | #317 | Tragic 81.5% |
| Choctaw | 0.0 /100 | #318 | Tragic 81.4% |
| Shoshone | 0.0 /100 | #319 | Tragic 81.4% |
| Yaqui | 0.0 /100 | #320 | Tragic 81.4% |
| Alaska Natives | 0.0 /100 | #321 | Tragic 81.3% |
Demographics Similar to Syrians by In Labor Force | Age 30-34
In terms of in labor force | age 30-34, the demographic groups most similar to Syrians are Northern European (84.8%, a difference of 0.0%), Immigrants from Sudan (84.8%, a difference of 0.0%), French Canadian (84.8%, a difference of 0.020%), Immigrants from Senegal (84.8%, a difference of 0.030%), and Romanian (84.8%, a difference of 0.030%).
| Demographics | Rating | Rank | In Labor Force | Age 30-34 |
| Immigrants | Saudi Arabia | 76.6 /100 | #146 | Good 84.9% |
| Immigrants | Colombia | 76.3 /100 | #147 | Good 84.9% |
| Immigrants | Pakistan | 76.2 /100 | #148 | Good 84.9% |
| Immigrants | Ukraine | 75.1 /100 | #149 | Good 84.8% |
| Germans | 75.1 /100 | #150 | Good 84.8% |
| Immigrants | Senegal | 74.0 /100 | #151 | Good 84.8% |
| Romanians | 73.5 /100 | #152 | Good 84.8% |
| Syrians | 70.1 /100 | #153 | Good 84.8% |
| Northern Europeans | 70.0 /100 | #154 | Good 84.8% |
| Immigrants | Sudan | 69.5 /100 | #155 | Good 84.8% |
| French Canadians | 67.3 /100 | #156 | Good 84.8% |
| Peruvians | 65.9 /100 | #157 | Good 84.8% |
| Immigrants | Armenia | 64.7 /100 | #158 | Good 84.8% |
| Czechoslovakians | 63.0 /100 | #159 | Good 84.8% |
| Pakistanis | 60.8 /100 | #160 | Good 84.7% |