Alaskan Athabascan vs Egyptian Associate's Degree
COMPARE
Alaskan Athabascan
Egyptian
Associate's Degree
Associate's Degree Comparison
Alaskan Athabascans
Egyptians
36.5%
ASSOCIATE'S DEGREE
0.0/ 100
METRIC RATING
328th/ 347
METRIC RANK
50.9%
ASSOCIATE'S DEGREE
99.5/ 100
METRIC RATING
69th/ 347
METRIC RANK
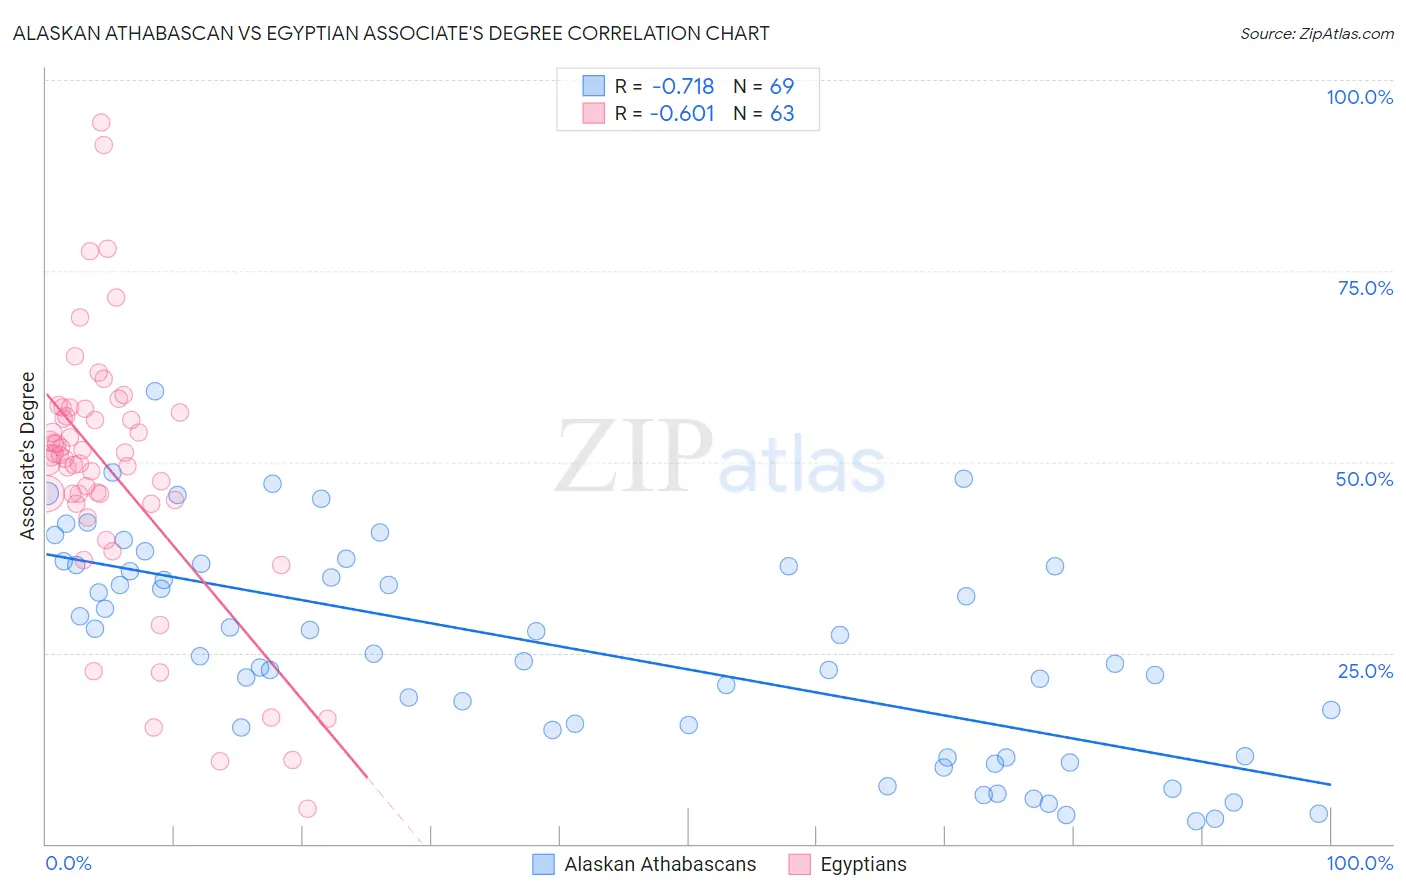
Alaskan Athabascan vs Egyptian Associate's Degree Correlation Chart
The statistical analysis conducted on geographies consisting of 45,819,945 people shows a strong negative correlation between the proportion of Alaskan Athabascans and percentage of population with at least associate's degree education in the United States with a correlation coefficient (R) of -0.718 and weighted average of 36.5%. Similarly, the statistical analysis conducted on geographies consisting of 276,910,507 people shows a significant negative correlation between the proportion of Egyptians and percentage of population with at least associate's degree education in the United States with a correlation coefficient (R) of -0.601 and weighted average of 50.9%, a difference of 39.7%.
Associate's Degree Correlation Summary
| Measurement | Alaskan Athabascan | Egyptian |
| Minimum | 3.0% | 4.6% |
| Maximum | 59.2% | 94.5% |
| Range | 56.2% | 89.9% |
| Mean | 25.6% | 48.7% |
| Median | 24.9% | 50.8% |
| Interquartile 25% (IQ1) | 13.2% | 44.6% |
| Interquartile 75% (IQ3) | 36.5% | 56.5% |
| Interquartile Range (IQR) | 23.3% | 11.9% |
| Standard Deviation (Sample) | 13.9% | 17.2% |
| Standard Deviation (Population) | 13.8% | 17.1% |
Similar Demographics by Associate's Degree
Demographics Similar to Alaskan Athabascans by Associate's Degree
In terms of associate's degree, the demographic groups most similar to Alaskan Athabascans are Dutch West Indian (36.5%, a difference of 0.010%), Kiowa (36.5%, a difference of 0.030%), Paiute (36.4%, a difference of 0.29%), Menominee (36.7%, a difference of 0.59%), and Apache (36.2%, a difference of 0.60%).
| Demographics | Rating | Rank | Associate's Degree |
| Immigrants | Yemen | 0.0 /100 | #321 | Tragic 37.3% |
| Pennsylvania Germans | 0.0 /100 | #322 | Tragic 37.2% |
| Immigrants | Cabo Verde | 0.0 /100 | #323 | Tragic 36.8% |
| Arapaho | 0.0 /100 | #324 | Tragic 36.7% |
| Menominee | 0.0 /100 | #325 | Tragic 36.7% |
| Kiowa | 0.0 /100 | #326 | Tragic 36.5% |
| Dutch West Indians | 0.0 /100 | #327 | Tragic 36.5% |
| Alaskan Athabascans | 0.0 /100 | #328 | Tragic 36.5% |
| Paiute | 0.0 /100 | #329 | Tragic 36.4% |
| Apache | 0.0 /100 | #330 | Tragic 36.2% |
| Immigrants | Azores | 0.0 /100 | #331 | Tragic 35.6% |
| Immigrants | Central America | 0.0 /100 | #332 | Tragic 35.0% |
| Mexicans | 0.0 /100 | #333 | Tragic 35.0% |
| Natives/Alaskans | 0.0 /100 | #334 | Tragic 34.9% |
| Spanish American Indians | 0.0 /100 | #335 | Tragic 34.9% |
Demographics Similar to Egyptians by Associate's Degree
In terms of associate's degree, the demographic groups most similar to Egyptians are Immigrants from Argentina (50.9%, a difference of 0.030%), Immigrants from Romania (50.9%, a difference of 0.040%), Immigrants from Pakistan (50.9%, a difference of 0.10%), Immigrants from Indonesia (51.0%, a difference of 0.12%), and Carpatho Rusyn (50.6%, a difference of 0.57%).
| Demographics | Rating | Rank | Associate's Degree |
| Bhutanese | 99.7 /100 | #62 | Exceptional 51.4% |
| South Africans | 99.7 /100 | #63 | Exceptional 51.4% |
| Immigrants | Netherlands | 99.7 /100 | #64 | Exceptional 51.4% |
| Zimbabweans | 99.7 /100 | #65 | Exceptional 51.3% |
| Immigrants | Europe | 99.7 /100 | #66 | Exceptional 51.3% |
| Argentineans | 99.6 /100 | #67 | Exceptional 51.2% |
| Immigrants | Indonesia | 99.5 /100 | #68 | Exceptional 51.0% |
| Egyptians | 99.5 /100 | #69 | Exceptional 50.9% |
| Immigrants | Argentina | 99.5 /100 | #70 | Exceptional 50.9% |
| Immigrants | Romania | 99.5 /100 | #71 | Exceptional 50.9% |
| Immigrants | Pakistan | 99.5 /100 | #72 | Exceptional 50.9% |
| Carpatho Rusyns | 99.3 /100 | #73 | Exceptional 50.6% |
| Lithuanians | 99.3 /100 | #74 | Exceptional 50.6% |
| Immigrants | Scotland | 99.3 /100 | #75 | Exceptional 50.6% |
| Immigrants | Zimbabwe | 99.2 /100 | #76 | Exceptional 50.5% |