Czech vs Bahamian Poverty
COMPARE
Czech
Bahamian
Poverty
Poverty Comparison
Czechs
Bahamians
10.8%
POVERTY
99.3/ 100
METRIC RATING
38th/ 347
METRIC RANK
15.4%
POVERTY
0.0/ 100
METRIC RATING
301st/ 347
METRIC RANK
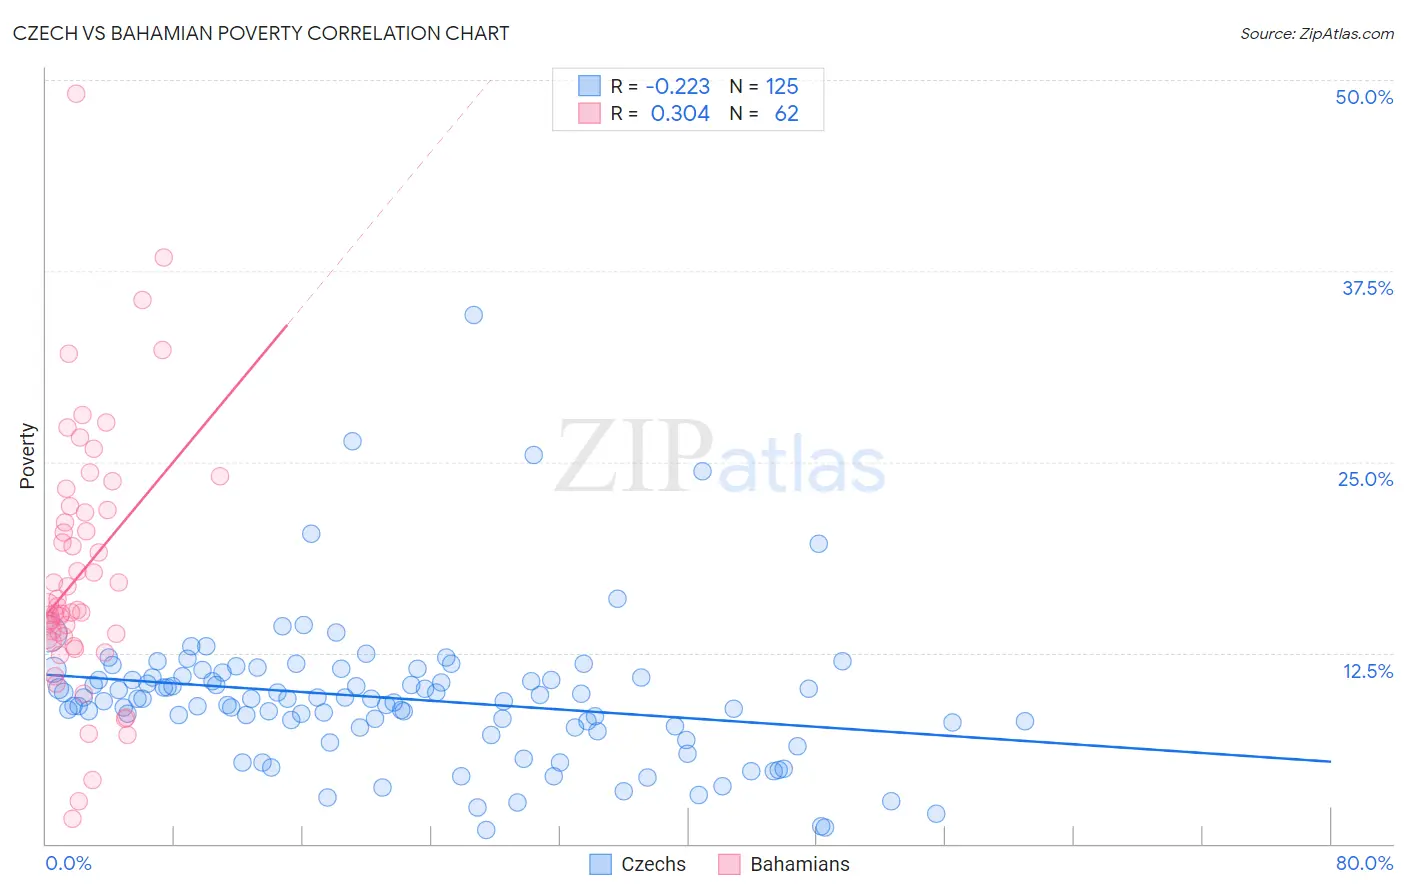
Czech vs Bahamian Poverty Correlation Chart
The statistical analysis conducted on geographies consisting of 484,408,527 people shows a weak negative correlation between the proportion of Czechs and poverty level in the United States with a correlation coefficient (R) of -0.223 and weighted average of 10.8%. Similarly, the statistical analysis conducted on geographies consisting of 112,639,225 people shows a mild positive correlation between the proportion of Bahamians and poverty level in the United States with a correlation coefficient (R) of 0.304 and weighted average of 15.4%, a difference of 42.0%.
Poverty Correlation Summary
| Measurement | Czech | Bahamian |
| Minimum | 0.93% | 1.7% |
| Maximum | 34.6% | 49.1% |
| Range | 33.7% | 47.4% |
| Mean | 9.5% | 17.8% |
| Median | 9.5% | 15.4% |
| Interquartile 25% (IQ1) | 7.6% | 13.4% |
| Interquartile 75% (IQ3) | 10.9% | 21.8% |
| Interquartile Range (IQR) | 3.3% | 8.4% |
| Standard Deviation (Sample) | 4.8% | 8.5% |
| Standard Deviation (Population) | 4.7% | 8.4% |
Similar Demographics by Poverty
Demographics Similar to Czechs by Poverty
In terms of poverty, the demographic groups most similar to Czechs are Immigrants from Greece (10.8%, a difference of 0.050%), Immigrants from Pakistan (10.8%, a difference of 0.080%), Russian (10.9%, a difference of 0.13%), Cypriot (10.8%, a difference of 0.14%), and Tongan (10.8%, a difference of 0.22%).
| Demographics | Rating | Rank | Poverty |
| Poles | 99.5 /100 | #31 | Exceptional 10.7% |
| Iranians | 99.5 /100 | #32 | Exceptional 10.7% |
| Macedonians | 99.4 /100 | #33 | Exceptional 10.8% |
| Immigrants | Poland | 99.4 /100 | #34 | Exceptional 10.8% |
| Tongans | 99.4 /100 | #35 | Exceptional 10.8% |
| Cypriots | 99.3 /100 | #36 | Exceptional 10.8% |
| Immigrants | Greece | 99.3 /100 | #37 | Exceptional 10.8% |
| Czechs | 99.3 /100 | #38 | Exceptional 10.8% |
| Immigrants | Pakistan | 99.3 /100 | #39 | Exceptional 10.8% |
| Russians | 99.3 /100 | #40 | Exceptional 10.9% |
| Immigrants | Iran | 99.2 /100 | #41 | Exceptional 10.9% |
| Koreans | 99.2 /100 | #42 | Exceptional 10.9% |
| Immigrants | Singapore | 99.2 /100 | #43 | Exceptional 10.9% |
| Immigrants | Moldova | 99.1 /100 | #44 | Exceptional 10.9% |
| Turks | 98.9 /100 | #45 | Exceptional 11.0% |
Demographics Similar to Bahamians by Poverty
In terms of poverty, the demographic groups most similar to Bahamians are Somali (15.4%, a difference of 0.13%), Immigrants from Central America (15.4%, a difference of 0.21%), Senegalese (15.3%, a difference of 0.59%), Immigrants from Caribbean (15.5%, a difference of 0.61%), and Immigrants from Senegal (15.3%, a difference of 0.68%).
| Demographics | Rating | Rank | Poverty |
| Blackfeet | 0.0 /100 | #294 | Tragic 15.2% |
| Guatemalans | 0.0 /100 | #295 | Tragic 15.3% |
| Hispanics or Latinos | 0.0 /100 | #296 | Tragic 15.3% |
| Immigrants | Bangladesh | 0.0 /100 | #297 | Tragic 15.3% |
| Immigrants | Senegal | 0.0 /100 | #298 | Tragic 15.3% |
| Senegalese | 0.0 /100 | #299 | Tragic 15.3% |
| Immigrants | Central America | 0.0 /100 | #300 | Tragic 15.4% |
| Bahamians | 0.0 /100 | #301 | Tragic 15.4% |
| Somalis | 0.0 /100 | #302 | Tragic 15.4% |
| Immigrants | Caribbean | 0.0 /100 | #303 | Tragic 15.5% |
| Immigrants | Mexico | 0.0 /100 | #304 | Tragic 15.5% |
| Immigrants | Guatemala | 0.0 /100 | #305 | Tragic 15.5% |
| Creek | 0.0 /100 | #306 | Tragic 15.6% |
| Africans | 0.0 /100 | #307 | Tragic 15.6% |
| Choctaw | 0.0 /100 | #308 | Tragic 15.6% |