Guatemalan vs Bahamian Poverty
COMPARE
Guatemalan
Bahamian
Poverty
Poverty Comparison
Guatemalans
Bahamians
15.3%
POVERTY
0.0/ 100
METRIC RATING
295th/ 347
METRIC RANK
15.4%
POVERTY
0.0/ 100
METRIC RATING
301st/ 347
METRIC RANK
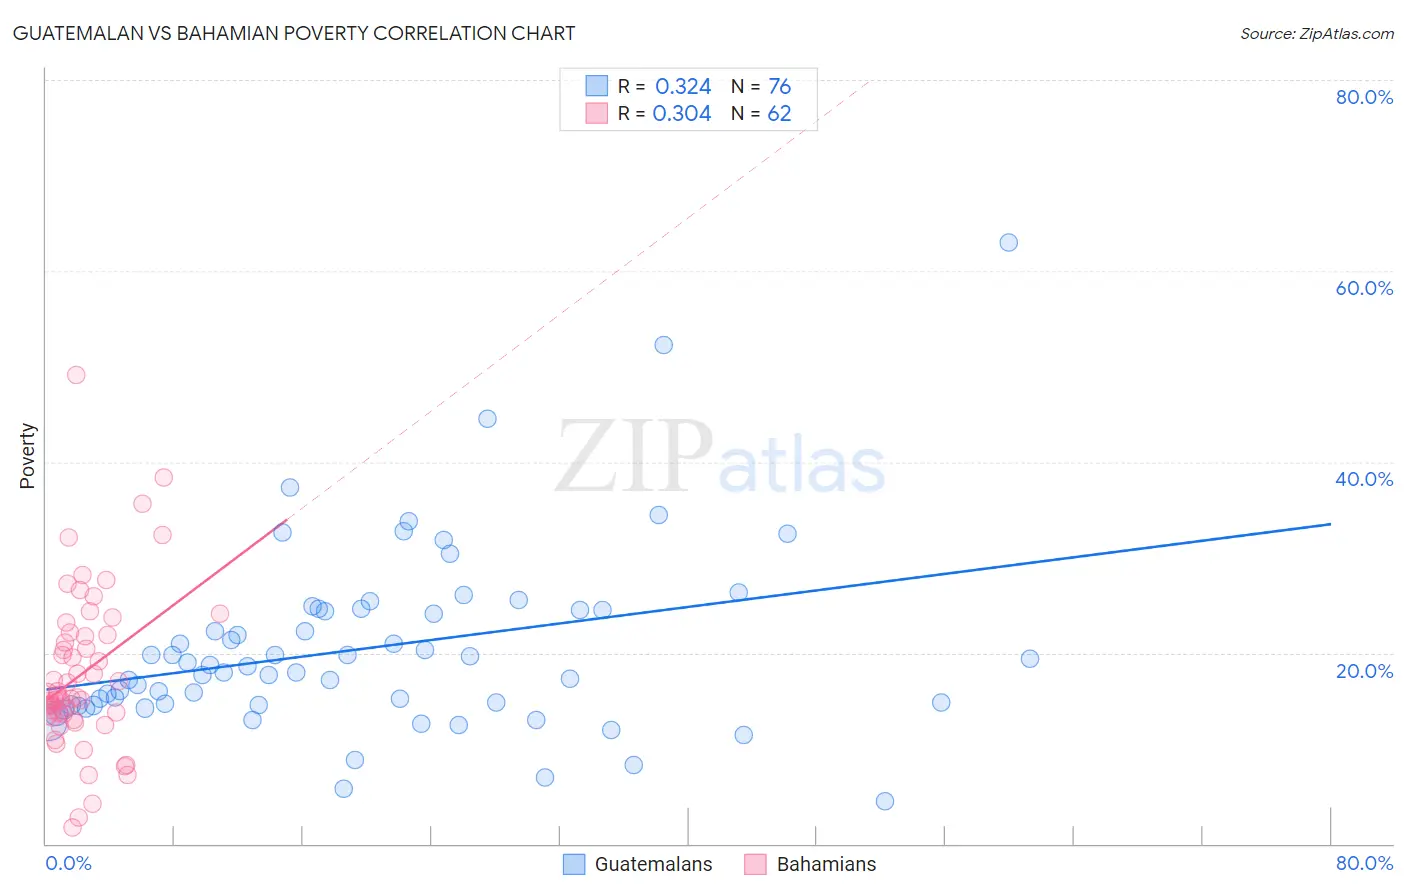
Guatemalan vs Bahamian Poverty Correlation Chart
The statistical analysis conducted on geographies consisting of 409,295,647 people shows a mild positive correlation between the proportion of Guatemalans and poverty level in the United States with a correlation coefficient (R) of 0.324 and weighted average of 15.3%. Similarly, the statistical analysis conducted on geographies consisting of 112,639,225 people shows a mild positive correlation between the proportion of Bahamians and poverty level in the United States with a correlation coefficient (R) of 0.304 and weighted average of 15.4%, a difference of 0.89%.
Poverty Correlation Summary
| Measurement | Guatemalan | Bahamian |
| Minimum | 4.4% | 1.7% |
| Maximum | 62.9% | 49.1% |
| Range | 58.5% | 47.4% |
| Mean | 20.4% | 17.8% |
| Median | 18.3% | 15.4% |
| Interquartile 25% (IQ1) | 14.5% | 13.4% |
| Interquartile 75% (IQ3) | 24.5% | 21.8% |
| Interquartile Range (IQR) | 10.0% | 8.4% |
| Standard Deviation (Sample) | 9.7% | 8.5% |
| Standard Deviation (Population) | 9.6% | 8.4% |
Demographics Similar to Guatemalans and Bahamians by Poverty
In terms of poverty, the demographic groups most similar to Guatemalans are Hispanic or Latino (15.3%, a difference of 0.010%), Immigrants from Bangladesh (15.3%, a difference of 0.050%), Immigrants from Senegal (15.3%, a difference of 0.20%), Senegalese (15.3%, a difference of 0.30%), and Blackfeet (15.2%, a difference of 0.42%). Similarly, the demographic groups most similar to Bahamians are Somali (15.4%, a difference of 0.13%), Immigrants from Central America (15.4%, a difference of 0.21%), Senegalese (15.3%, a difference of 0.59%), Immigrants from Caribbean (15.5%, a difference of 0.61%), and Immigrants from Senegal (15.3%, a difference of 0.68%).
| Demographics | Rating | Rank | Poverty |
| Yaqui | 0.0 /100 | #288 | Tragic 15.1% |
| Immigrants | Belize | 0.0 /100 | #289 | Tragic 15.1% |
| Mexicans | 0.0 /100 | #290 | Tragic 15.1% |
| Immigrants | Cabo Verde | 0.0 /100 | #291 | Tragic 15.1% |
| Indonesians | 0.0 /100 | #292 | Tragic 15.1% |
| Immigrants | Zaire | 0.0 /100 | #293 | Tragic 15.1% |
| Blackfeet | 0.0 /100 | #294 | Tragic 15.2% |
| Guatemalans | 0.0 /100 | #295 | Tragic 15.3% |
| Hispanics or Latinos | 0.0 /100 | #296 | Tragic 15.3% |
| Immigrants | Bangladesh | 0.0 /100 | #297 | Tragic 15.3% |
| Immigrants | Senegal | 0.0 /100 | #298 | Tragic 15.3% |
| Senegalese | 0.0 /100 | #299 | Tragic 15.3% |
| Immigrants | Central America | 0.0 /100 | #300 | Tragic 15.4% |
| Bahamians | 0.0 /100 | #301 | Tragic 15.4% |
| Somalis | 0.0 /100 | #302 | Tragic 15.4% |
| Immigrants | Caribbean | 0.0 /100 | #303 | Tragic 15.5% |
| Immigrants | Mexico | 0.0 /100 | #304 | Tragic 15.5% |
| Immigrants | Guatemala | 0.0 /100 | #305 | Tragic 15.5% |
| Creek | 0.0 /100 | #306 | Tragic 15.6% |
| Africans | 0.0 /100 | #307 | Tragic 15.6% |
| Choctaw | 0.0 /100 | #308 | Tragic 15.6% |