African vs Norwegian Single Female Poverty
COMPARE
African
Norwegian
Single Female Poverty
Single Female Poverty Comparison
Africans
Norwegians
24.8%
SINGLE FEMALE POVERTY
0.0/ 100
METRIC RATING
296th/ 347
METRIC RANK
20.8%
SINGLE FEMALE POVERTY
63.0/ 100
METRIC RATING
166th/ 347
METRIC RANK
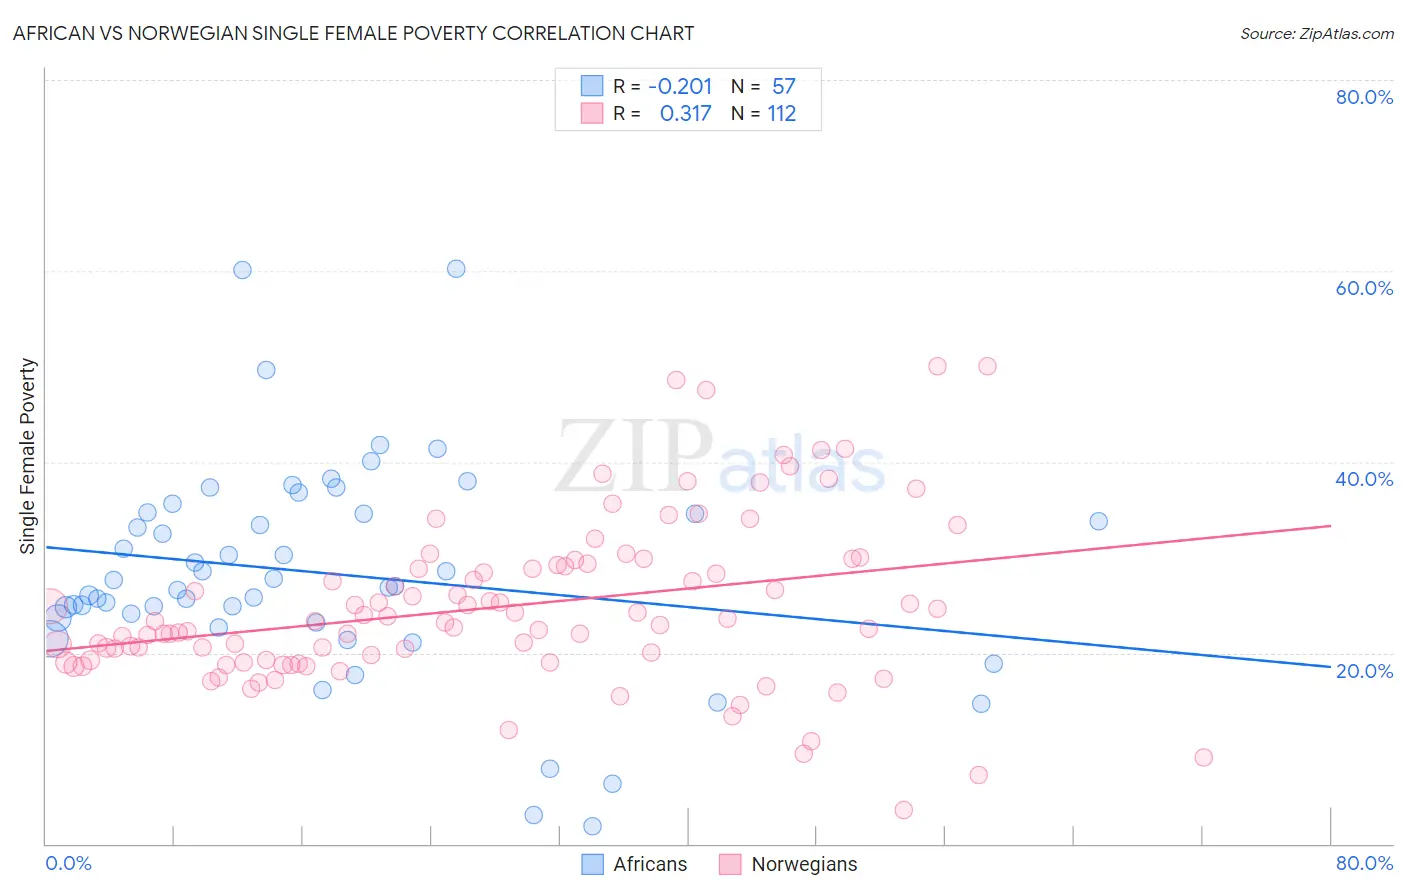
African vs Norwegian Single Female Poverty Correlation Chart
The statistical analysis conducted on geographies consisting of 463,525,497 people shows a weak negative correlation between the proportion of Africans and poverty level among single females in the United States with a correlation coefficient (R) of -0.201 and weighted average of 24.8%. Similarly, the statistical analysis conducted on geographies consisting of 516,441,916 people shows a mild positive correlation between the proportion of Norwegians and poverty level among single females in the United States with a correlation coefficient (R) of 0.317 and weighted average of 20.8%, a difference of 18.8%.
Single Female Poverty Correlation Summary
| Measurement | African | Norwegian |
| Minimum | 1.9% | 3.6% |
| Maximum | 60.3% | 50.0% |
| Range | 58.4% | 46.4% |
| Mean | 28.3% | 24.8% |
| Median | 27.0% | 23.2% |
| Interquartile 25% (IQ1) | 23.4% | 19.1% |
| Interquartile 75% (IQ3) | 34.6% | 29.1% |
| Interquartile Range (IQR) | 11.2% | 10.0% |
| Standard Deviation (Sample) | 11.2% | 8.7% |
| Standard Deviation (Population) | 11.1% | 8.7% |
Similar Demographics by Single Female Poverty
Demographics Similar to Africans by Single Female Poverty
In terms of single female poverty, the demographic groups most similar to Africans are Immigrants from Central America (24.8%, a difference of 0.28%), Hispanic or Latino (24.6%, a difference of 0.48%), Yaqui (24.9%, a difference of 0.48%), French American Indian (24.6%, a difference of 0.83%), and American (24.5%, a difference of 0.98%).
| Demographics | Rating | Rank | Single Female Poverty |
| U.S. Virgin Islanders | 0.0 /100 | #289 | Tragic 24.2% |
| Indonesians | 0.0 /100 | #290 | Tragic 24.3% |
| Osage | 0.0 /100 | #291 | Tragic 24.4% |
| Alsatians | 0.0 /100 | #292 | Tragic 24.5% |
| Americans | 0.0 /100 | #293 | Tragic 24.5% |
| French American Indians | 0.0 /100 | #294 | Tragic 24.6% |
| Hispanics or Latinos | 0.0 /100 | #295 | Tragic 24.6% |
| Africans | 0.0 /100 | #296 | Tragic 24.8% |
| Immigrants | Central America | 0.0 /100 | #297 | Tragic 24.8% |
| Yaqui | 0.0 /100 | #298 | Tragic 24.9% |
| Mexicans | 0.0 /100 | #299 | Tragic 25.0% |
| Blackfeet | 0.0 /100 | #300 | Tragic 25.1% |
| Hondurans | 0.0 /100 | #301 | Tragic 25.1% |
| Shoshone | 0.0 /100 | #302 | Tragic 25.1% |
| Somalis | 0.0 /100 | #303 | Tragic 25.2% |
Demographics Similar to Norwegians by Single Female Poverty
In terms of single female poverty, the demographic groups most similar to Norwegians are Immigrants from Norway (20.8%, a difference of 0.0%), Ugandan (20.8%, a difference of 0.060%), Iraqi (20.8%, a difference of 0.10%), Immigrants from Costa Rica (20.9%, a difference of 0.10%), and Lebanese (20.8%, a difference of 0.32%).
| Demographics | Rating | Rank | Single Female Poverty |
| Costa Ricans | 71.8 /100 | #159 | Good 20.7% |
| Arabs | 70.8 /100 | #160 | Good 20.7% |
| Kenyans | 68.5 /100 | #161 | Good 20.8% |
| Northern Europeans | 68.4 /100 | #162 | Good 20.8% |
| Lebanese | 67.6 /100 | #163 | Good 20.8% |
| Iraqis | 64.5 /100 | #164 | Good 20.8% |
| Ugandans | 64.0 /100 | #165 | Good 20.8% |
| Norwegians | 63.0 /100 | #166 | Good 20.8% |
| Immigrants | Norway | 63.0 /100 | #167 | Good 20.8% |
| Immigrants | Costa Rica | 61.5 /100 | #168 | Good 20.9% |
| Immigrants | Trinidad and Tobago | 56.3 /100 | #169 | Average 20.9% |
| New Zealanders | 53.2 /100 | #170 | Average 21.0% |
| Moroccans | 52.8 /100 | #171 | Average 21.0% |
| Guyanese | 52.0 /100 | #172 | Average 21.0% |
| Immigrants | Guyana | 50.6 /100 | #173 | Average 21.0% |