African vs Subsaharan African Single Female Poverty
COMPARE
African
Subsaharan African
Single Female Poverty
Single Female Poverty Comparison
Africans
Sub-Saharan Africans
24.8%
SINGLE FEMALE POVERTY
0.0/ 100
METRIC RATING
296th/ 347
METRIC RANK
23.2%
SINGLE FEMALE POVERTY
0.1/ 100
METRIC RATING
271st/ 347
METRIC RANK
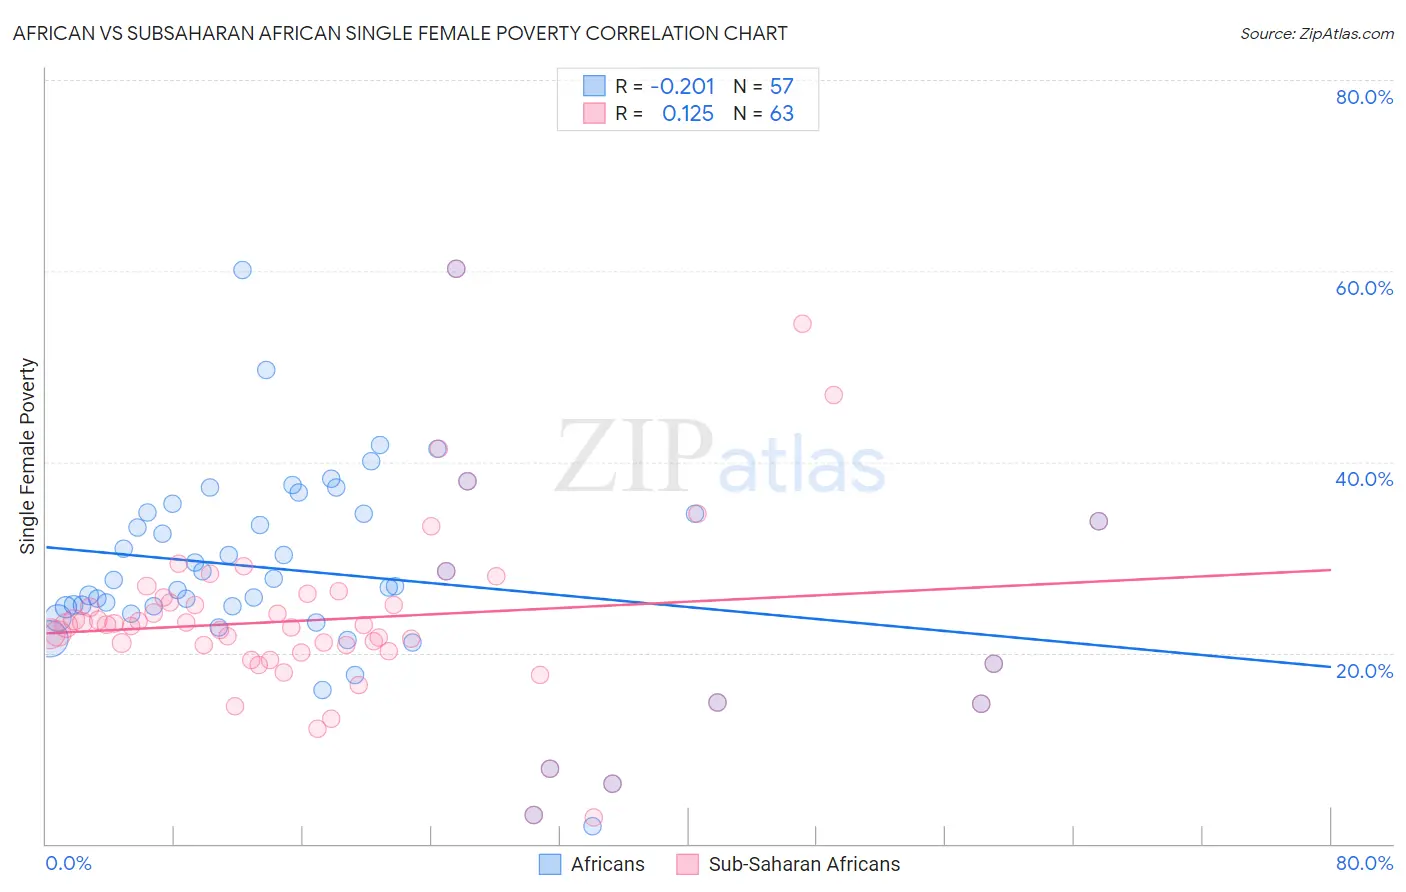
African vs Subsaharan African Single Female Poverty Correlation Chart
The statistical analysis conducted on geographies consisting of 463,525,497 people shows a weak negative correlation between the proportion of Africans and poverty level among single females in the United States with a correlation coefficient (R) of -0.201 and weighted average of 24.8%. Similarly, the statistical analysis conducted on geographies consisting of 498,393,739 people shows a poor positive correlation between the proportion of Sub-Saharan Africans and poverty level among single females in the United States with a correlation coefficient (R) of 0.125 and weighted average of 23.2%, a difference of 6.8%.
Single Female Poverty Correlation Summary
| Measurement | African | Subsaharan African |
| Minimum | 1.9% | 2.8% |
| Maximum | 60.3% | 60.3% |
| Range | 58.4% | 57.5% |
| Mean | 28.3% | 23.6% |
| Median | 27.0% | 22.9% |
| Interquartile 25% (IQ1) | 23.4% | 19.3% |
| Interquartile 75% (IQ3) | 34.6% | 26.2% |
| Interquartile Range (IQR) | 11.2% | 6.9% |
| Standard Deviation (Sample) | 11.2% | 9.9% |
| Standard Deviation (Population) | 11.1% | 9.8% |
Similar Demographics by Single Female Poverty
Demographics Similar to Africans by Single Female Poverty
In terms of single female poverty, the demographic groups most similar to Africans are Immigrants from Central America (24.8%, a difference of 0.28%), Hispanic or Latino (24.6%, a difference of 0.48%), Yaqui (24.9%, a difference of 0.48%), French American Indian (24.6%, a difference of 0.83%), and American (24.5%, a difference of 0.98%).
| Demographics | Rating | Rank | Single Female Poverty |
| U.S. Virgin Islanders | 0.0 /100 | #289 | Tragic 24.2% |
| Indonesians | 0.0 /100 | #290 | Tragic 24.3% |
| Osage | 0.0 /100 | #291 | Tragic 24.4% |
| Alsatians | 0.0 /100 | #292 | Tragic 24.5% |
| Americans | 0.0 /100 | #293 | Tragic 24.5% |
| French American Indians | 0.0 /100 | #294 | Tragic 24.6% |
| Hispanics or Latinos | 0.0 /100 | #295 | Tragic 24.6% |
| Africans | 0.0 /100 | #296 | Tragic 24.8% |
| Immigrants | Central America | 0.0 /100 | #297 | Tragic 24.8% |
| Yaqui | 0.0 /100 | #298 | Tragic 24.9% |
| Mexicans | 0.0 /100 | #299 | Tragic 25.0% |
| Blackfeet | 0.0 /100 | #300 | Tragic 25.1% |
| Hondurans | 0.0 /100 | #301 | Tragic 25.1% |
| Shoshone | 0.0 /100 | #302 | Tragic 25.1% |
| Somalis | 0.0 /100 | #303 | Tragic 25.2% |
Demographics Similar to Sub-Saharan Africans by Single Female Poverty
In terms of single female poverty, the demographic groups most similar to Sub-Saharan Africans are Immigrants from Senegal (23.2%, a difference of 0.19%), Inupiat (23.1%, a difference of 0.25%), Alaska Native (23.3%, a difference of 0.44%), Marshallese (23.3%, a difference of 0.45%), and Hmong (23.1%, a difference of 0.50%).
| Demographics | Rating | Rank | Single Female Poverty |
| Immigrants | Laos | 0.3 /100 | #264 | Tragic 22.9% |
| Central Americans | 0.2 /100 | #265 | Tragic 23.0% |
| Immigrants | Micronesia | 0.2 /100 | #266 | Tragic 23.0% |
| Senegalese | 0.2 /100 | #267 | Tragic 23.0% |
| Fijians | 0.2 /100 | #268 | Tragic 23.1% |
| Hmong | 0.2 /100 | #269 | Tragic 23.1% |
| Inupiat | 0.2 /100 | #270 | Tragic 23.1% |
| Sub-Saharan Africans | 0.1 /100 | #271 | Tragic 23.2% |
| Immigrants | Senegal | 0.1 /100 | #272 | Tragic 23.2% |
| Alaska Natives | 0.1 /100 | #273 | Tragic 23.3% |
| Marshallese | 0.1 /100 | #274 | Tragic 23.3% |
| Mexican American Indians | 0.1 /100 | #275 | Tragic 23.4% |
| Immigrants | Azores | 0.0 /100 | #276 | Tragic 23.5% |
| Pennsylvania Germans | 0.0 /100 | #277 | Tragic 23.6% |
| Immigrants | Nonimmigrants | 0.0 /100 | #278 | Tragic 23.6% |