African vs Indonesian Female Poverty Among 25-34 Year Olds
COMPARE
African
Indonesian
Female Poverty Among 25-34 Year Olds
Female Poverty Among 25-34 Year Olds Comparison
Africans
Indonesians
17.0%
FEMALE POVERTY AMONG 25-34 YEAR OLDS
0.0/ 100
METRIC RATING
308th/ 347
METRIC RANK
16.4%
FEMALE POVERTY AMONG 25-34 YEAR OLDS
0.0/ 100
METRIC RATING
290th/ 347
METRIC RANK
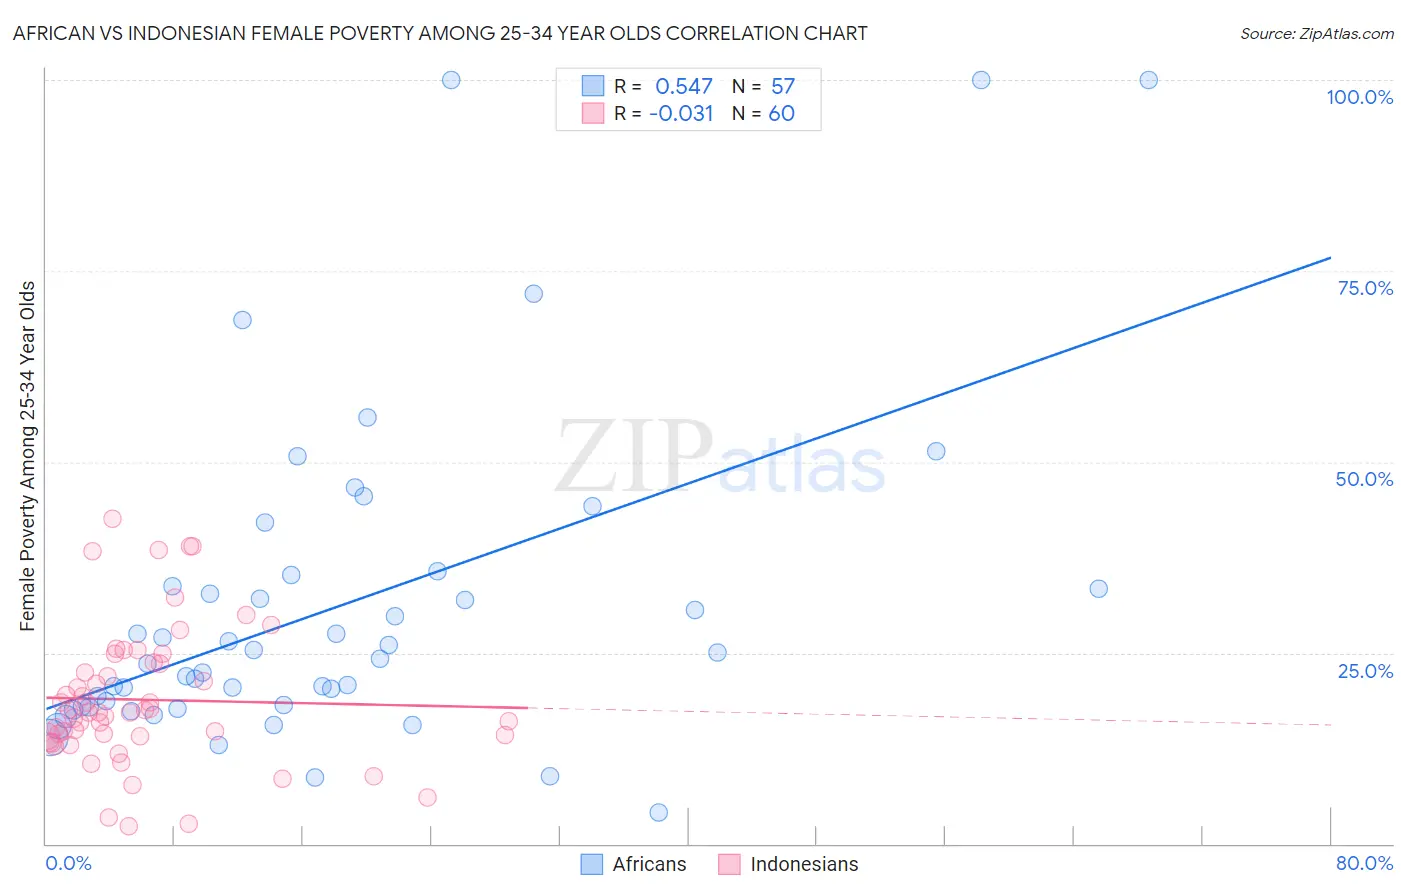
African vs Indonesian Female Poverty Among 25-34 Year Olds Correlation Chart
The statistical analysis conducted on geographies consisting of 463,188,909 people shows a substantial positive correlation between the proportion of Africans and poverty level among females between the ages 25 and 34 in the United States with a correlation coefficient (R) of 0.547 and weighted average of 17.0%. Similarly, the statistical analysis conducted on geographies consisting of 161,815,054 people shows no correlation between the proportion of Indonesians and poverty level among females between the ages 25 and 34 in the United States with a correlation coefficient (R) of -0.031 and weighted average of 16.4%, a difference of 3.8%.
Female Poverty Among 25-34 Year Olds Correlation Summary
| Measurement | African | Indonesian |
| Minimum | 4.1% | 2.3% |
| Maximum | 100.0% | 42.5% |
| Range | 95.9% | 40.2% |
| Mean | 31.0% | 18.9% |
| Median | 24.2% | 17.2% |
| Interquartile 25% (IQ1) | 17.9% | 14.1% |
| Interquartile 75% (IQ3) | 34.5% | 23.6% |
| Interquartile Range (IQR) | 16.5% | 9.6% |
| Standard Deviation (Sample) | 21.4% | 8.9% |
| Standard Deviation (Population) | 21.2% | 8.9% |
Demographics Similar to Africans and Indonesians by Female Poverty Among 25-34 Year Olds
In terms of female poverty among 25-34 year olds, the demographic groups most similar to Africans are Yaqui (17.0%, a difference of 0.20%), Chickasaw (17.0%, a difference of 0.22%), Ottawa (17.1%, a difference of 0.30%), Immigrants from Cabo Verde (16.9%, a difference of 0.80%), and Honduran (16.9%, a difference of 0.97%). Similarly, the demographic groups most similar to Indonesians are Osage (16.4%, a difference of 0.16%), Comanche (16.5%, a difference of 0.28%), Immigrants from Dominica (16.5%, a difference of 0.30%), Potawatomi (16.5%, a difference of 0.57%), and Immigrants from Central America (16.6%, a difference of 0.93%).
| Demographics | Rating | Rank | Female Poverty Among 25-34 Year Olds |
| Osage | 0.0 /100 | #289 | Tragic 16.4% |
| Indonesians | 0.0 /100 | #290 | Tragic 16.4% |
| Comanche | 0.0 /100 | #291 | Tragic 16.5% |
| Immigrants | Dominica | 0.0 /100 | #292 | Tragic 16.5% |
| Potawatomi | 0.0 /100 | #293 | Tragic 16.5% |
| Immigrants | Central America | 0.0 /100 | #294 | Tragic 16.6% |
| Mexicans | 0.0 /100 | #295 | Tragic 16.6% |
| Hispanics or Latinos | 0.0 /100 | #296 | Tragic 16.6% |
| Immigrants | Guatemala | 0.0 /100 | #297 | Tragic 16.6% |
| Blackfeet | 0.0 /100 | #298 | Tragic 16.7% |
| Spanish Americans | 0.0 /100 | #299 | Tragic 16.7% |
| U.S. Virgin Islanders | 0.0 /100 | #300 | Tragic 16.7% |
| Immigrants | Congo | 0.0 /100 | #301 | Tragic 16.7% |
| Alaska Natives | 0.0 /100 | #302 | Tragic 16.8% |
| Immigrants | Mexico | 0.0 /100 | #303 | Tragic 16.8% |
| Hondurans | 0.0 /100 | #304 | Tragic 16.9% |
| Immigrants | Cabo Verde | 0.0 /100 | #305 | Tragic 16.9% |
| Chickasaw | 0.0 /100 | #306 | Tragic 17.0% |
| Yaqui | 0.0 /100 | #307 | Tragic 17.0% |
| Africans | 0.0 /100 | #308 | Tragic 17.0% |
| Ottawa | 0.0 /100 | #309 | Tragic 17.1% |