Immigrants from Uganda vs Lithuanian Single Male Poverty
COMPARE
Immigrants from Uganda
Lithuanian
Single Male Poverty
Single Male Poverty Comparison
Immigrants from Uganda
Lithuanians
12.6%
SINGLE MALE POVERTY
75.9/ 100
METRIC RATING
142nd/ 347
METRIC RANK
13.0%
SINGLE MALE POVERTY
22.1/ 100
METRIC RATING
198th/ 347
METRIC RANK
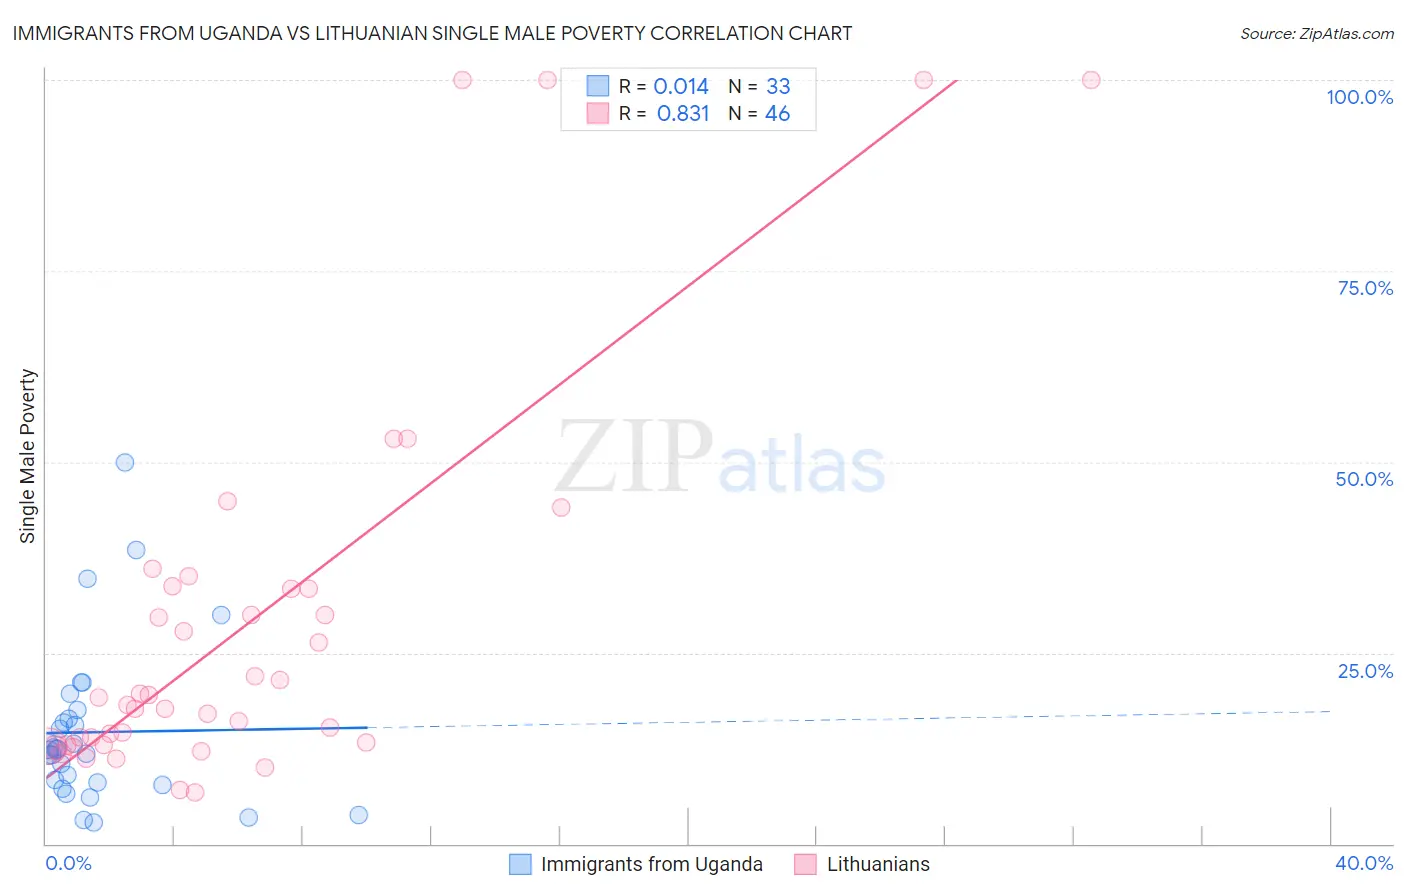
Immigrants from Uganda vs Lithuanian Single Male Poverty Correlation Chart
The statistical analysis conducted on geographies consisting of 119,797,773 people shows no correlation between the proportion of Immigrants from Uganda and poverty level among single males in the United States with a correlation coefficient (R) of 0.014 and weighted average of 12.6%. Similarly, the statistical analysis conducted on geographies consisting of 363,241,212 people shows a very strong positive correlation between the proportion of Lithuanians and poverty level among single males in the United States with a correlation coefficient (R) of 0.831 and weighted average of 13.0%, a difference of 3.2%.
Single Male Poverty Correlation Summary
| Measurement | Immigrants from Uganda | Lithuanian |
| Minimum | 2.7% | 6.7% |
| Maximum | 50.0% | 100.0% |
| Range | 47.3% | 93.3% |
| Mean | 14.6% | 28.6% |
| Median | 12.4% | 18.7% |
| Interquartile 25% (IQ1) | 7.8% | 12.9% |
| Interquartile 75% (IQ3) | 17.0% | 33.3% |
| Interquartile Range (IQR) | 9.1% | 20.5% |
| Standard Deviation (Sample) | 10.5% | 25.0% |
| Standard Deviation (Population) | 10.3% | 24.8% |
Similar Demographics by Single Male Poverty
Demographics Similar to Immigrants from Uganda by Single Male Poverty
In terms of single male poverty, the demographic groups most similar to Immigrants from Uganda are Okinawan (12.6%, a difference of 0.0%), Immigrants from France (12.6%, a difference of 0.010%), Hawaiian (12.6%, a difference of 0.060%), Immigrants from Lebanon (12.6%, a difference of 0.070%), and Native Hawaiian (12.6%, a difference of 0.070%).
| Demographics | Rating | Rank | Single Male Poverty |
| Immigrants | Costa Rica | 81.9 /100 | #135 | Excellent 12.5% |
| Immigrants | Austria | 81.9 /100 | #136 | Excellent 12.5% |
| Ukrainians | 80.7 /100 | #137 | Excellent 12.6% |
| Immigrants | El Salvador | 80.0 /100 | #138 | Excellent 12.6% |
| Cubans | 79.9 /100 | #139 | Good 12.6% |
| Immigrants | Zimbabwe | 78.0 /100 | #140 | Good 12.6% |
| Okinawans | 75.9 /100 | #141 | Good 12.6% |
| Immigrants | Uganda | 75.9 /100 | #142 | Good 12.6% |
| Immigrants | France | 75.8 /100 | #143 | Good 12.6% |
| Hawaiians | 75.1 /100 | #144 | Good 12.6% |
| Immigrants | Lebanon | 75.0 /100 | #145 | Good 12.6% |
| Native Hawaiians | 75.0 /100 | #146 | Good 12.6% |
| Malaysians | 74.8 /100 | #147 | Good 12.6% |
| Yugoslavians | 73.9 /100 | #148 | Good 12.6% |
| Sierra Leoneans | 73.0 /100 | #149 | Good 12.6% |
Demographics Similar to Lithuanians by Single Male Poverty
In terms of single male poverty, the demographic groups most similar to Lithuanians are Immigrants from Norway (13.0%, a difference of 0.020%), Slovene (13.0%, a difference of 0.040%), Trinidadian and Tobagonian (13.0%, a difference of 0.050%), Immigrants from Laos (13.0%, a difference of 0.070%), and Immigrants from Grenada (13.0%, a difference of 0.080%).
| Demographics | Rating | Rank | Single Male Poverty |
| Immigrants | Thailand | 26.6 /100 | #191 | Fair 13.0% |
| Immigrants | Jamaica | 26.5 /100 | #192 | Fair 13.0% |
| Immigrants | South Africa | 26.1 /100 | #193 | Fair 13.0% |
| Liberians | 25.2 /100 | #194 | Fair 13.0% |
| Immigrants | England | 23.4 /100 | #195 | Fair 13.0% |
| Immigrants | Grenada | 23.1 /100 | #196 | Fair 13.0% |
| Immigrants | Laos | 23.1 /100 | #197 | Fair 13.0% |
| Lithuanians | 22.1 /100 | #198 | Fair 13.0% |
| Immigrants | Norway | 21.8 /100 | #199 | Fair 13.0% |
| Slovenes | 21.6 /100 | #200 | Fair 13.0% |
| Trinidadians and Tobagonians | 21.4 /100 | #201 | Fair 13.0% |
| Basques | 20.7 /100 | #202 | Fair 13.0% |
| Immigrants | Bangladesh | 20.4 /100 | #203 | Fair 13.0% |
| Estonians | 20.3 /100 | #204 | Fair 13.0% |
| Poles | 19.3 /100 | #205 | Poor 13.0% |