Zip Codes with the Highest Percentage of Households Heated by Bottled Gas / Liquid Propane in Brick, NJ
RELATED REPORTS & OPTIONS
Bottled Gas / LP Heating
Brick
Compare Zip Codes
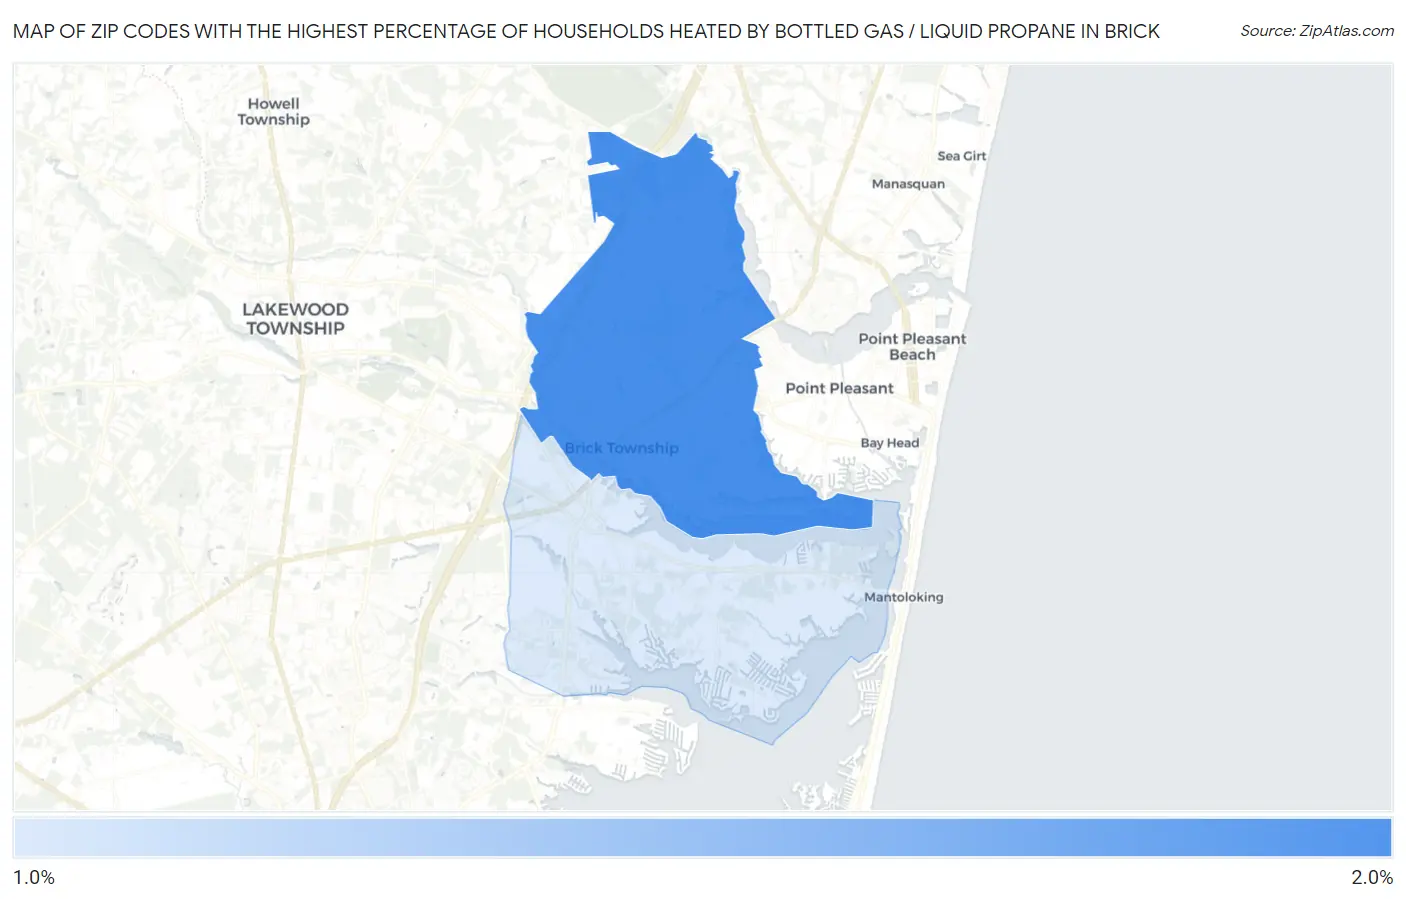
Map of Zip Codes with the Highest Percentage of Households Heated by Bottled Gas / Liquid Propane in Brick
1.3%
1.9%
Zip Codes with the Highest Percentage of Households Heated by Bottled Gas / Liquid Propane in Brick, NJ
| Zip Code | Bottled Gas / LP Heating | vs State | vs National | |
| 1. | 08724 | 1.9% | 2.4%(-0.500)#259 | 4.9%(-3.00)#23,414 |
| 2. | 08723 | 1.3% | 2.4%(-1.10)#346 | 4.9%(-3.60)#25,445 |
1
Common Questions
What are the Top Zip Codes with the Highest Percentage of Households Heated by Bottled Gas / Liquid Propane in Brick, NJ?
Top Zip Codes with the Highest Percentage of Households Heated by Bottled Gas / Liquid Propane in Brick, NJ are:
What zip code has the Highest Percentage of Households Heated by Bottled Gas / Liquid Propane in Brick, NJ?
08724 has the Highest Percentage of Households Heated by Bottled Gas / Liquid Propane in Brick, NJ with 1.9%.
What is the Percentage of Households Heated by Bottled Gas / Liquid Propane in New Jersey?
Percentage of Households Heated by Bottled Gas / Liquid Propane in New Jersey is 2.4%.
What is the Percentage of Households Heated by Bottled Gas / Liquid Propane in the United States?
Percentage of Households Heated by Bottled Gas / Liquid Propane in the United States is 4.9%.