Yugoslavian vs Egyptian In Labor Force | Age 30-34
COMPARE
Yugoslavian
Egyptian
In Labor Force | Age 30-34
In Labor Force | Age 30-34 Comparison
Yugoslavians
Egyptians
85.1%
IN LABOR FORCE | AGE 30-34
94.7/ 100
METRIC RATING
114th/ 347
METRIC RANK
85.1%
IN LABOR FORCE | AGE 30-34
94.5/ 100
METRIC RATING
116th/ 347
METRIC RANK
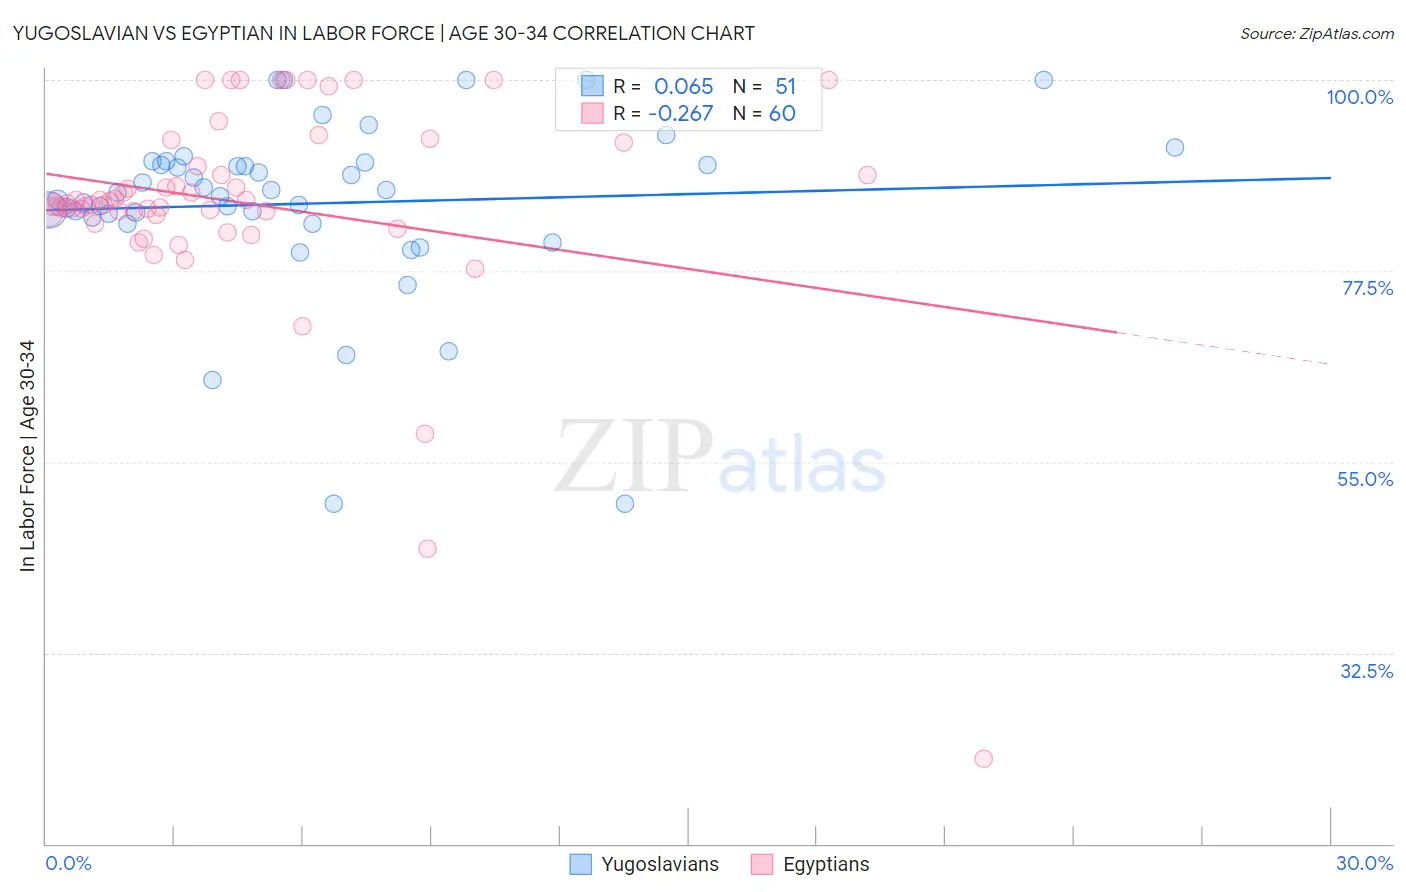
Yugoslavian vs Egyptian In Labor Force | Age 30-34 Correlation Chart
The statistical analysis conducted on geographies consisting of 285,635,237 people shows a slight positive correlation between the proportion of Yugoslavians and labor force participation rate among population between the ages 30 and 34 in the United States with a correlation coefficient (R) of 0.065 and weighted average of 85.1%. Similarly, the statistical analysis conducted on geographies consisting of 276,796,346 people shows a weak negative correlation between the proportion of Egyptians and labor force participation rate among population between the ages 30 and 34 in the United States with a correlation coefficient (R) of -0.267 and weighted average of 85.1%, a difference of 0.010%.
In Labor Force | Age 30-34 Correlation Summary
| Measurement | Yugoslavian | Egyptian |
| Minimum | 50.0% | 20.0% |
| Maximum | 100.0% | 100.0% |
| Range | 50.0% | 80.0% |
| Mean | 85.4% | 85.5% |
| Median | 86.8% | 85.4% |
| Interquartile 25% (IQ1) | 83.8% | 84.3% |
| Interquartile 75% (IQ3) | 90.2% | 91.3% |
| Interquartile Range (IQR) | 6.4% | 7.0% |
| Standard Deviation (Sample) | 10.4% | 12.8% |
| Standard Deviation (Population) | 10.3% | 12.7% |
Demographics Similar to Yugoslavians and Egyptians by In Labor Force | Age 30-34
In terms of in labor force | age 30-34, the demographic groups most similar to Yugoslavians are Immigrants from Hungary (85.1%, a difference of 0.0%), Immigrants from Romania (85.1%, a difference of 0.0%), Immigrants from South Central Asia (85.1%, a difference of 0.0%), Immigrants from Scotland (85.1%, a difference of 0.010%), and Immigrants from Denmark (85.1%, a difference of 0.010%). Similarly, the demographic groups most similar to Egyptians are Immigrants from South Central Asia (85.1%, a difference of 0.0%), Immigrants from Scotland (85.1%, a difference of 0.010%), Immigrants from Hungary (85.1%, a difference of 0.010%), Immigrants from Romania (85.1%, a difference of 0.010%), and Immigrants from Denmark (85.1%, a difference of 0.010%).
| Demographics | Rating | Rank | In Labor Force | Age 30-34 |
| Alsatians | 96.3 /100 | #105 | Exceptional 85.2% |
| Immigrants | Middle Africa | 96.3 /100 | #106 | Exceptional 85.2% |
| Immigrants | Northern Africa | 96.3 /100 | #107 | Exceptional 85.2% |
| Immigrants | Zimbabwe | 95.8 /100 | #108 | Exceptional 85.1% |
| Argentineans | 95.8 /100 | #109 | Exceptional 85.1% |
| Immigrants | South Africa | 95.3 /100 | #110 | Exceptional 85.1% |
| Immigrants | Scotland | 94.9 /100 | #111 | Exceptional 85.1% |
| Immigrants | Hungary | 94.8 /100 | #112 | Exceptional 85.1% |
| Immigrants | Romania | 94.7 /100 | #113 | Exceptional 85.1% |
| Yugoslavians | 94.7 /100 | #114 | Exceptional 85.1% |
| Immigrants | South Central Asia | 94.6 /100 | #115 | Exceptional 85.1% |
| Egyptians | 94.5 /100 | #116 | Exceptional 85.1% |
| Immigrants | Denmark | 94.3 /100 | #117 | Exceptional 85.1% |
| Immigrants | Malaysia | 94.2 /100 | #118 | Exceptional 85.1% |
| Asians | 93.4 /100 | #119 | Exceptional 85.1% |
| Immigrants | Southern Europe | 93.3 /100 | #120 | Exceptional 85.1% |
| Immigrants | Egypt | 93.2 /100 | #121 | Exceptional 85.1% |
| Immigrants | Kuwait | 92.6 /100 | #122 | Exceptional 85.1% |
| Armenians | 92.2 /100 | #123 | Exceptional 85.0% |
| Australians | 92.0 /100 | #124 | Exceptional 85.0% |
| Immigrants | Jordan | 91.5 /100 | #125 | Exceptional 85.0% |