Yugoslavian vs Immigrants from Taiwan In Labor Force | Age 30-34
COMPARE
Yugoslavian
Immigrants from Taiwan
In Labor Force | Age 30-34
In Labor Force | Age 30-34 Comparison
Yugoslavians
Immigrants from Taiwan
85.1%
IN LABOR FORCE | AGE 30-34
94.7/ 100
METRIC RATING
114th/ 347
METRIC RANK
85.3%
IN LABOR FORCE | AGE 30-34
98.3/ 100
METRIC RATING
86th/ 347
METRIC RANK
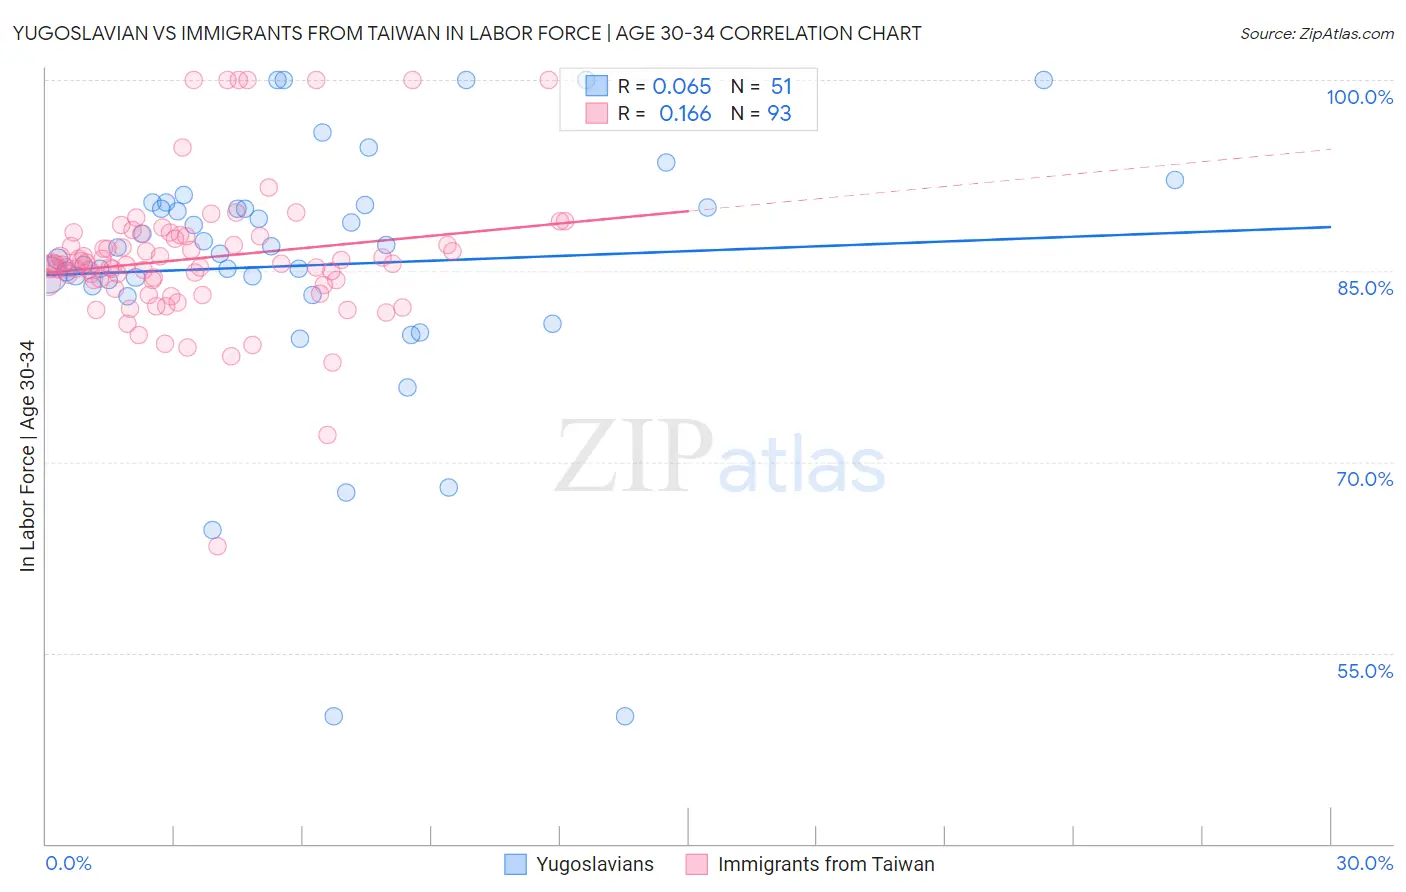
Yugoslavian vs Immigrants from Taiwan In Labor Force | Age 30-34 Correlation Chart
The statistical analysis conducted on geographies consisting of 285,635,237 people shows a slight positive correlation between the proportion of Yugoslavians and labor force participation rate among population between the ages 30 and 34 in the United States with a correlation coefficient (R) of 0.065 and weighted average of 85.1%. Similarly, the statistical analysis conducted on geographies consisting of 298,154,729 people shows a poor positive correlation between the proportion of Immigrants from Taiwan and labor force participation rate among population between the ages 30 and 34 in the United States with a correlation coefficient (R) of 0.166 and weighted average of 85.3%, a difference of 0.20%.
In Labor Force | Age 30-34 Correlation Summary
| Measurement | Yugoslavian | Immigrants from Taiwan |
| Minimum | 50.0% | 63.4% |
| Maximum | 100.0% | 100.0% |
| Range | 50.0% | 36.6% |
| Mean | 85.4% | 86.0% |
| Median | 86.8% | 85.5% |
| Interquartile 25% (IQ1) | 83.8% | 84.0% |
| Interquartile 75% (IQ3) | 90.2% | 87.7% |
| Interquartile Range (IQR) | 6.4% | 3.7% |
| Standard Deviation (Sample) | 10.4% | 5.5% |
| Standard Deviation (Population) | 10.3% | 5.5% |
Similar Demographics by In Labor Force | Age 30-34
Demographics Similar to Yugoslavians by In Labor Force | Age 30-34
In terms of in labor force | age 30-34, the demographic groups most similar to Yugoslavians are Immigrants from Hungary (85.1%, a difference of 0.0%), Immigrants from Romania (85.1%, a difference of 0.0%), Immigrants from South Central Asia (85.1%, a difference of 0.0%), Immigrants from Scotland (85.1%, a difference of 0.010%), and Egyptian (85.1%, a difference of 0.010%).
| Demographics | Rating | Rank | In Labor Force | Age 30-34 |
| Immigrants | Northern Africa | 96.3 /100 | #107 | Exceptional 85.2% |
| Immigrants | Zimbabwe | 95.8 /100 | #108 | Exceptional 85.1% |
| Argentineans | 95.8 /100 | #109 | Exceptional 85.1% |
| Immigrants | South Africa | 95.3 /100 | #110 | Exceptional 85.1% |
| Immigrants | Scotland | 94.9 /100 | #111 | Exceptional 85.1% |
| Immigrants | Hungary | 94.8 /100 | #112 | Exceptional 85.1% |
| Immigrants | Romania | 94.7 /100 | #113 | Exceptional 85.1% |
| Yugoslavians | 94.7 /100 | #114 | Exceptional 85.1% |
| Immigrants | South Central Asia | 94.6 /100 | #115 | Exceptional 85.1% |
| Egyptians | 94.5 /100 | #116 | Exceptional 85.1% |
| Immigrants | Denmark | 94.3 /100 | #117 | Exceptional 85.1% |
| Immigrants | Malaysia | 94.2 /100 | #118 | Exceptional 85.1% |
| Asians | 93.4 /100 | #119 | Exceptional 85.1% |
| Immigrants | Southern Europe | 93.3 /100 | #120 | Exceptional 85.1% |
| Immigrants | Egypt | 93.2 /100 | #121 | Exceptional 85.1% |
Demographics Similar to Immigrants from Taiwan by In Labor Force | Age 30-34
In terms of in labor force | age 30-34, the demographic groups most similar to Immigrants from Taiwan are Immigrants from Northern Europe (85.3%, a difference of 0.0%), Immigrants from Belgium (85.3%, a difference of 0.010%), Mongolian (85.3%, a difference of 0.020%), Immigrants from Kazakhstan (85.3%, a difference of 0.020%), and Greek (85.3%, a difference of 0.030%).
| Demographics | Rating | Rank | In Labor Force | Age 30-34 |
| Immigrants | Switzerland | 98.7 /100 | #79 | Exceptional 85.3% |
| Immigrants | Russia | 98.7 /100 | #80 | Exceptional 85.3% |
| Slovaks | 98.7 /100 | #81 | Exceptional 85.3% |
| Immigrants | Africa | 98.6 /100 | #82 | Exceptional 85.3% |
| Immigrants | Europe | 98.6 /100 | #83 | Exceptional 85.3% |
| Greeks | 98.6 /100 | #84 | Exceptional 85.3% |
| Mongolians | 98.5 /100 | #85 | Exceptional 85.3% |
| Immigrants | Taiwan | 98.3 /100 | #86 | Exceptional 85.3% |
| Immigrants | Northern Europe | 98.2 /100 | #87 | Exceptional 85.3% |
| Immigrants | Belgium | 98.2 /100 | #88 | Exceptional 85.3% |
| Immigrants | Kazakhstan | 98.1 /100 | #89 | Exceptional 85.3% |
| Burmese | 97.9 /100 | #90 | Exceptional 85.3% |
| Immigrants | Moldova | 97.9 /100 | #91 | Exceptional 85.3% |
| German Russians | 97.7 /100 | #92 | Exceptional 85.2% |
| Immigrants | Norway | 97.6 /100 | #93 | Exceptional 85.2% |