British vs Egyptian In Labor Force | Age 30-34
COMPARE
British
Egyptian
In Labor Force | Age 30-34
In Labor Force | Age 30-34 Comparison
British
Egyptians
84.5%
IN LABOR FORCE | AGE 30-34
22.9/ 100
METRIC RATING
196th/ 347
METRIC RANK
85.1%
IN LABOR FORCE | AGE 30-34
94.5/ 100
METRIC RATING
116th/ 347
METRIC RANK
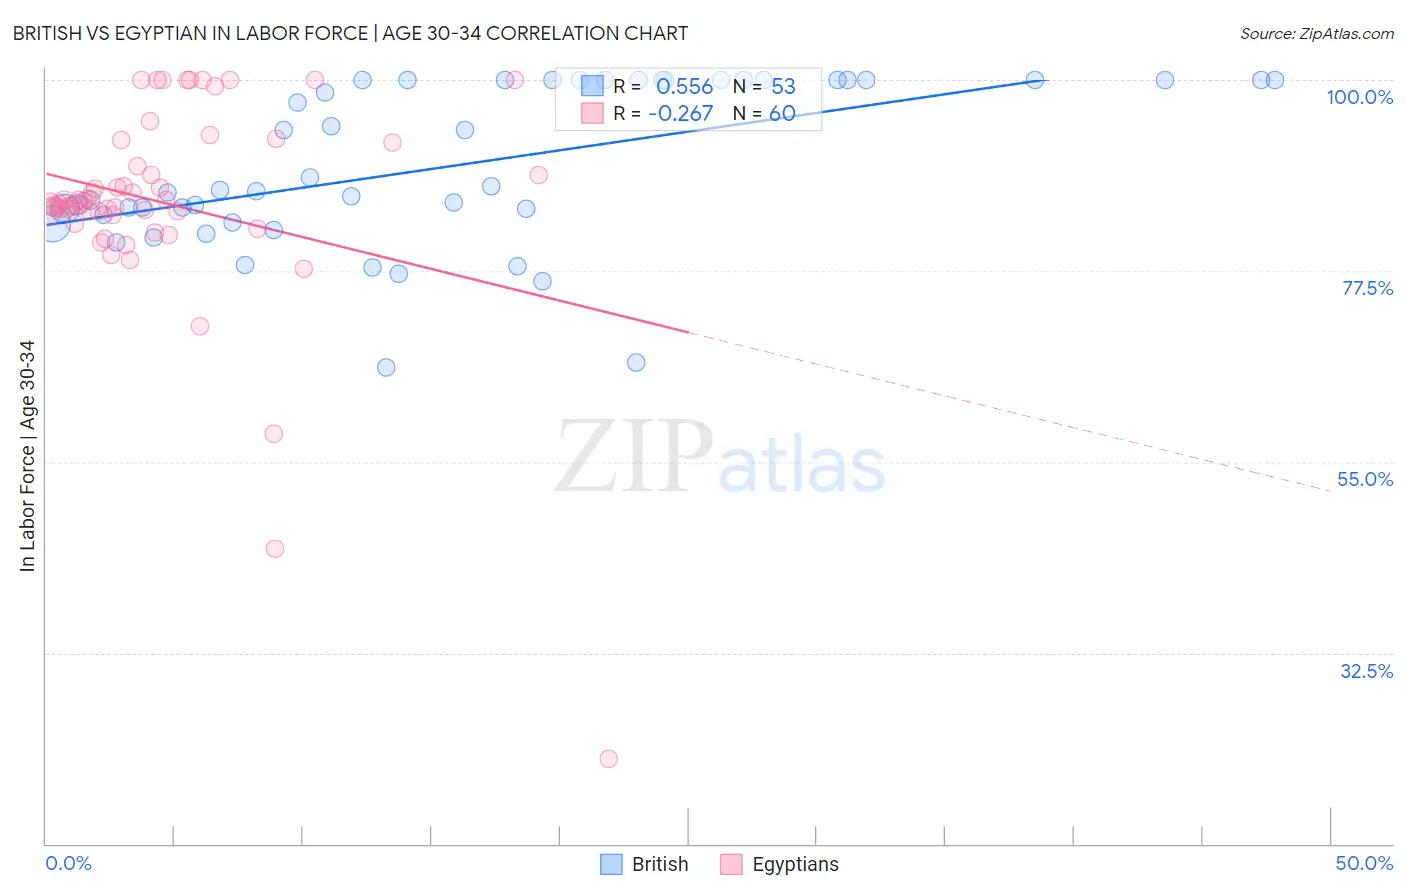
British vs Egyptian In Labor Force | Age 30-34 Correlation Chart
The statistical analysis conducted on geographies consisting of 530,789,592 people shows a substantial positive correlation between the proportion of British and labor force participation rate among population between the ages 30 and 34 in the United States with a correlation coefficient (R) of 0.556 and weighted average of 84.5%. Similarly, the statistical analysis conducted on geographies consisting of 276,796,346 people shows a weak negative correlation between the proportion of Egyptians and labor force participation rate among population between the ages 30 and 34 in the United States with a correlation coefficient (R) of -0.267 and weighted average of 85.1%, a difference of 0.71%.
In Labor Force | Age 30-34 Correlation Summary
| Measurement | British | Egyptian |
| Minimum | 66.1% | 20.0% |
| Maximum | 100.0% | 100.0% |
| Range | 33.9% | 80.0% |
| Mean | 89.9% | 85.5% |
| Median | 87.0% | 85.4% |
| Interquartile 25% (IQ1) | 83.7% | 84.3% |
| Interquartile 75% (IQ3) | 100.0% | 91.3% |
| Interquartile Range (IQR) | 16.3% | 7.0% |
| Standard Deviation (Sample) | 9.4% | 12.8% |
| Standard Deviation (Population) | 9.4% | 12.7% |
Similar Demographics by In Labor Force | Age 30-34
Demographics Similar to British by In Labor Force | Age 30-34
In terms of in labor force | age 30-34, the demographic groups most similar to British are Korean (84.5%, a difference of 0.0%), Immigrants from Costa Rica (84.5%, a difference of 0.010%), Immigrants from Afghanistan (84.5%, a difference of 0.010%), Immigrants from Syria (84.5%, a difference of 0.010%), and Hungarian (84.5%, a difference of 0.020%).
| Demographics | Rating | Rank | In Labor Force | Age 30-34 |
| Nigerians | 28.9 /100 | #189 | Fair 84.5% |
| Immigrants | Zaire | 25.8 /100 | #190 | Fair 84.5% |
| Hungarians | 24.8 /100 | #191 | Fair 84.5% |
| Scandinavians | 24.7 /100 | #192 | Fair 84.5% |
| Immigrants | Costa Rica | 23.9 /100 | #193 | Fair 84.5% |
| Immigrants | Afghanistan | 23.5 /100 | #194 | Fair 84.5% |
| Koreans | 23.2 /100 | #195 | Fair 84.5% |
| British | 22.9 /100 | #196 | Fair 84.5% |
| Immigrants | Syria | 21.9 /100 | #197 | Fair 84.5% |
| Dutch | 20.2 /100 | #198 | Fair 84.5% |
| Immigrants | Thailand | 19.1 /100 | #199 | Poor 84.5% |
| Sub-Saharan Africans | 19.0 /100 | #200 | Poor 84.5% |
| Trinidadians and Tobagonians | 18.2 /100 | #201 | Poor 84.5% |
| Immigrants | West Indies | 18.1 /100 | #202 | Poor 84.5% |
| Canadians | 15.4 /100 | #203 | Poor 84.4% |
Demographics Similar to Egyptians by In Labor Force | Age 30-34
In terms of in labor force | age 30-34, the demographic groups most similar to Egyptians are Immigrants from South Central Asia (85.1%, a difference of 0.0%), Immigrants from Scotland (85.1%, a difference of 0.010%), Immigrants from Hungary (85.1%, a difference of 0.010%), Immigrants from Romania (85.1%, a difference of 0.010%), and Yugoslavian (85.1%, a difference of 0.010%).
| Demographics | Rating | Rank | In Labor Force | Age 30-34 |
| Argentineans | 95.8 /100 | #109 | Exceptional 85.1% |
| Immigrants | South Africa | 95.3 /100 | #110 | Exceptional 85.1% |
| Immigrants | Scotland | 94.9 /100 | #111 | Exceptional 85.1% |
| Immigrants | Hungary | 94.8 /100 | #112 | Exceptional 85.1% |
| Immigrants | Romania | 94.7 /100 | #113 | Exceptional 85.1% |
| Yugoslavians | 94.7 /100 | #114 | Exceptional 85.1% |
| Immigrants | South Central Asia | 94.6 /100 | #115 | Exceptional 85.1% |
| Egyptians | 94.5 /100 | #116 | Exceptional 85.1% |
| Immigrants | Denmark | 94.3 /100 | #117 | Exceptional 85.1% |
| Immigrants | Malaysia | 94.2 /100 | #118 | Exceptional 85.1% |
| Asians | 93.4 /100 | #119 | Exceptional 85.1% |
| Immigrants | Southern Europe | 93.3 /100 | #120 | Exceptional 85.1% |
| Immigrants | Egypt | 93.2 /100 | #121 | Exceptional 85.1% |
| Immigrants | Kuwait | 92.6 /100 | #122 | Exceptional 85.1% |
| Armenians | 92.2 /100 | #123 | Exceptional 85.0% |