Immigrants from St. Vincent and the Grenadines vs Egyptian In Labor Force | Age 30-34
COMPARE
Immigrants from St. Vincent and the Grenadines
Egyptian
In Labor Force | Age 30-34
In Labor Force | Age 30-34 Comparison
Immigrants from St. Vincent and the Grenadines
Egyptians
83.9%
IN LABOR FORCE | AGE 30-34
0.5/ 100
METRIC RATING
254th/ 347
METRIC RANK
85.1%
IN LABOR FORCE | AGE 30-34
94.5/ 100
METRIC RATING
116th/ 347
METRIC RANK
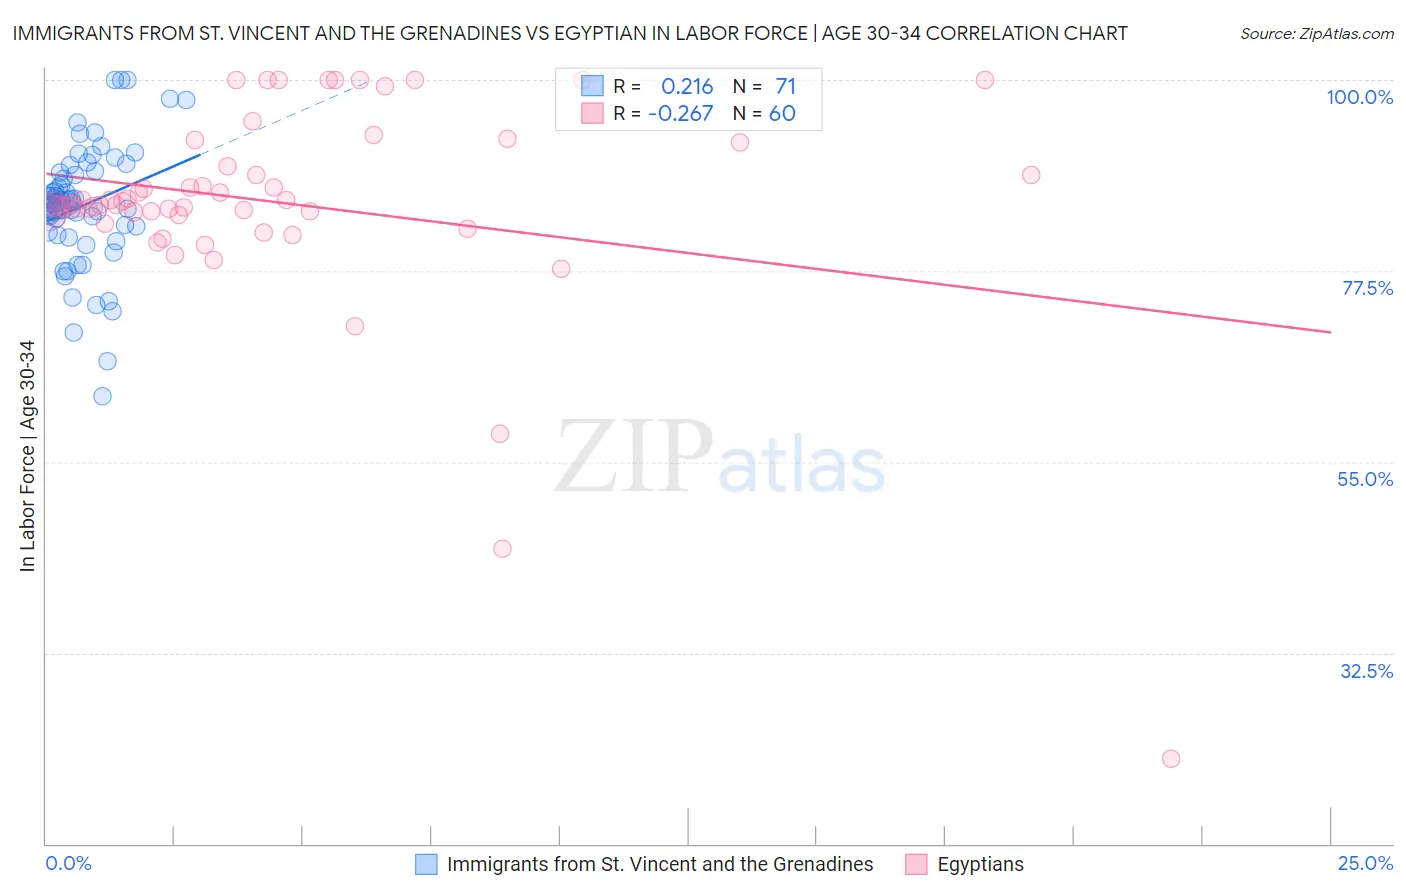
Immigrants from St. Vincent and the Grenadines vs Egyptian In Labor Force | Age 30-34 Correlation Chart
The statistical analysis conducted on geographies consisting of 56,189,108 people shows a weak positive correlation between the proportion of Immigrants from St. Vincent and the Grenadines and labor force participation rate among population between the ages 30 and 34 in the United States with a correlation coefficient (R) of 0.216 and weighted average of 83.9%. Similarly, the statistical analysis conducted on geographies consisting of 276,796,346 people shows a weak negative correlation between the proportion of Egyptians and labor force participation rate among population between the ages 30 and 34 in the United States with a correlation coefficient (R) of -0.267 and weighted average of 85.1%, a difference of 1.4%.
In Labor Force | Age 30-34 Correlation Summary
| Measurement | Immigrants from St. Vincent and the Grenadines | Egyptian |
| Minimum | 62.8% | 20.0% |
| Maximum | 100.0% | 100.0% |
| Range | 37.2% | 80.0% |
| Mean | 85.2% | 85.5% |
| Median | 85.6% | 85.4% |
| Interquartile 25% (IQ1) | 82.0% | 84.3% |
| Interquartile 75% (IQ3) | 89.1% | 91.3% |
| Interquartile Range (IQR) | 7.1% | 7.0% |
| Standard Deviation (Sample) | 7.1% | 12.8% |
| Standard Deviation (Population) | 7.1% | 12.7% |
Similar Demographics by In Labor Force | Age 30-34
Demographics Similar to Immigrants from St. Vincent and the Grenadines by In Labor Force | Age 30-34
In terms of in labor force | age 30-34, the demographic groups most similar to Immigrants from St. Vincent and the Grenadines are Bahamian (83.9%, a difference of 0.020%), Immigrants from Nicaragua (83.9%, a difference of 0.020%), White/Caucasian (83.9%, a difference of 0.020%), Nicaraguan (83.9%, a difference of 0.030%), and Immigrants from Iraq (83.9%, a difference of 0.040%).
| Demographics | Rating | Rank | In Labor Force | Age 30-34 |
| British West Indians | 0.8 /100 | #247 | Tragic 84.0% |
| Portuguese | 0.8 /100 | #248 | Tragic 84.0% |
| Immigrants | Dominica | 0.7 /100 | #249 | Tragic 84.0% |
| Immigrants | Iraq | 0.7 /100 | #250 | Tragic 83.9% |
| Nicaraguans | 0.6 /100 | #251 | Tragic 83.9% |
| Bahamians | 0.6 /100 | #252 | Tragic 83.9% |
| Immigrants | Nicaragua | 0.6 /100 | #253 | Tragic 83.9% |
| Immigrants | St. Vincent and the Grenadines | 0.5 /100 | #254 | Tragic 83.9% |
| Whites/Caucasians | 0.5 /100 | #255 | Tragic 83.9% |
| Immigrants | Lebanon | 0.4 /100 | #256 | Tragic 83.9% |
| Iraqis | 0.3 /100 | #257 | Tragic 83.8% |
| Hondurans | 0.3 /100 | #258 | Tragic 83.8% |
| Scotch-Irish | 0.3 /100 | #259 | Tragic 83.8% |
| Immigrants | Dominican Republic | 0.3 /100 | #260 | Tragic 83.8% |
| Guyanese | 0.3 /100 | #261 | Tragic 83.8% |
Demographics Similar to Egyptians by In Labor Force | Age 30-34
In terms of in labor force | age 30-34, the demographic groups most similar to Egyptians are Immigrants from South Central Asia (85.1%, a difference of 0.0%), Immigrants from Scotland (85.1%, a difference of 0.010%), Immigrants from Hungary (85.1%, a difference of 0.010%), Immigrants from Romania (85.1%, a difference of 0.010%), and Yugoslavian (85.1%, a difference of 0.010%).
| Demographics | Rating | Rank | In Labor Force | Age 30-34 |
| Argentineans | 95.8 /100 | #109 | Exceptional 85.1% |
| Immigrants | South Africa | 95.3 /100 | #110 | Exceptional 85.1% |
| Immigrants | Scotland | 94.9 /100 | #111 | Exceptional 85.1% |
| Immigrants | Hungary | 94.8 /100 | #112 | Exceptional 85.1% |
| Immigrants | Romania | 94.7 /100 | #113 | Exceptional 85.1% |
| Yugoslavians | 94.7 /100 | #114 | Exceptional 85.1% |
| Immigrants | South Central Asia | 94.6 /100 | #115 | Exceptional 85.1% |
| Egyptians | 94.5 /100 | #116 | Exceptional 85.1% |
| Immigrants | Denmark | 94.3 /100 | #117 | Exceptional 85.1% |
| Immigrants | Malaysia | 94.2 /100 | #118 | Exceptional 85.1% |
| Asians | 93.4 /100 | #119 | Exceptional 85.1% |
| Immigrants | Southern Europe | 93.3 /100 | #120 | Exceptional 85.1% |
| Immigrants | Egypt | 93.2 /100 | #121 | Exceptional 85.1% |
| Immigrants | Kuwait | 92.6 /100 | #122 | Exceptional 85.1% |
| Armenians | 92.2 /100 | #123 | Exceptional 85.0% |