Yaqui vs Immigrants from Kenya In Labor Force | Age > 16
COMPARE
Yaqui
Immigrants from Kenya
In Labor Force | Age > 16
In Labor Force | Age > 16 Comparison
Yaqui
Immigrants from Kenya
63.0%
IN LABOR FORCE | AGE > 16
0.0/ 100
METRIC RATING
314th/ 347
METRIC RANK
67.6%
IN LABOR FORCE | AGE > 16
100.0/ 100
METRIC RATING
20th/ 347
METRIC RANK
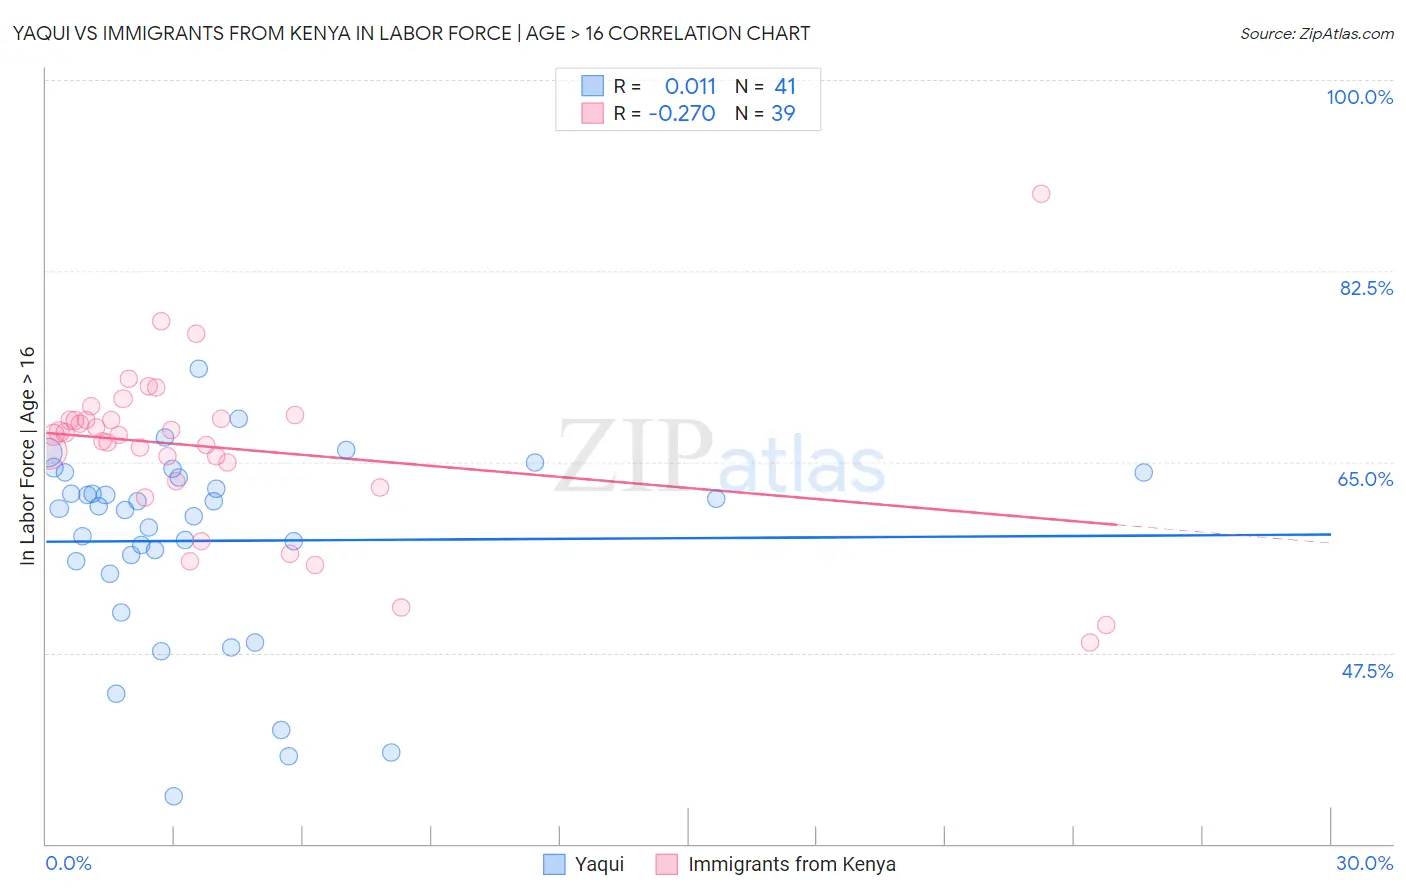
Yaqui vs Immigrants from Kenya In Labor Force | Age > 16 Correlation Chart
The statistical analysis conducted on geographies consisting of 107,721,250 people shows no correlation between the proportion of Yaqui and labor force participation rate among population ages 16 and over in the United States with a correlation coefficient (R) of 0.011 and weighted average of 63.0%. Similarly, the statistical analysis conducted on geographies consisting of 218,088,200 people shows a weak negative correlation between the proportion of Immigrants from Kenya and labor force participation rate among population ages 16 and over in the United States with a correlation coefficient (R) of -0.270 and weighted average of 67.6%, a difference of 7.1%.
In Labor Force | Age > 16 Correlation Summary
| Measurement | Yaqui | Immigrants from Kenya |
| Minimum | 34.4% | 48.4% |
| Maximum | 73.5% | 89.6% |
| Range | 39.1% | 41.2% |
| Mean | 57.8% | 66.2% |
| Median | 60.7% | 67.4% |
| Interquartile 25% (IQ1) | 55.3% | 63.2% |
| Interquartile 75% (IQ3) | 63.8% | 69.0% |
| Interquartile Range (IQR) | 8.5% | 5.8% |
| Standard Deviation (Sample) | 8.9% | 7.6% |
| Standard Deviation (Population) | 8.8% | 7.5% |
Similar Demographics by In Labor Force | Age > 16
Demographics Similar to Yaqui by In Labor Force | Age > 16
In terms of in labor force | age > 16, the demographic groups most similar to Yaqui are Chippewa (63.1%, a difference of 0.10%), Iroquois (63.2%, a difference of 0.23%), Blackfeet (63.2%, a difference of 0.29%), Shoshone (63.2%, a difference of 0.30%), and Potawatomi (62.8%, a difference of 0.35%).
| Demographics | Rating | Rank | In Labor Force | Age > 16 |
| Central American Indians | 0.0 /100 | #307 | Tragic 63.4% |
| Pennsylvania Germans | 0.0 /100 | #308 | Tragic 63.4% |
| Scotch-Irish | 0.0 /100 | #309 | Tragic 63.3% |
| Shoshone | 0.0 /100 | #310 | Tragic 63.2% |
| Blackfeet | 0.0 /100 | #311 | Tragic 63.2% |
| Iroquois | 0.0 /100 | #312 | Tragic 63.2% |
| Chippewa | 0.0 /100 | #313 | Tragic 63.1% |
| Yaqui | 0.0 /100 | #314 | Tragic 63.0% |
| Potawatomi | 0.0 /100 | #315 | Tragic 62.8% |
| Yup'ik | 0.0 /100 | #316 | Tragic 62.7% |
| Kiowa | 0.0 /100 | #317 | Tragic 62.4% |
| Chickasaw | 0.0 /100 | #318 | Tragic 62.3% |
| Arapaho | 0.0 /100 | #319 | Tragic 62.1% |
| Yakama | 0.0 /100 | #320 | Tragic 62.1% |
| Americans | 0.0 /100 | #321 | Tragic 62.1% |
Demographics Similar to Immigrants from Kenya by In Labor Force | Age > 16
In terms of in labor force | age > 16, the demographic groups most similar to Immigrants from Kenya are Tongan (67.5%, a difference of 0.020%), Kenyan (67.6%, a difference of 0.050%), Immigrants from Uganda (67.5%, a difference of 0.080%), Immigrants from Liberia (67.6%, a difference of 0.090%), and Immigrants from India (67.6%, a difference of 0.10%).
| Demographics | Rating | Rank | In Labor Force | Age > 16 |
| Immigrants | Nepal | 100.0 /100 | #13 | Exceptional 68.0% |
| Liberians | 100.0 /100 | #14 | Exceptional 67.8% |
| Immigrants | Middle Africa | 100.0 /100 | #15 | Exceptional 67.7% |
| Immigrants | Sudan | 100.0 /100 | #16 | Exceptional 67.7% |
| Immigrants | India | 100.0 /100 | #17 | Exceptional 67.6% |
| Immigrants | Liberia | 100.0 /100 | #18 | Exceptional 67.6% |
| Kenyans | 100.0 /100 | #19 | Exceptional 67.6% |
| Immigrants | Kenya | 100.0 /100 | #20 | Exceptional 67.6% |
| Tongans | 100.0 /100 | #21 | Exceptional 67.5% |
| Immigrants | Uganda | 100.0 /100 | #22 | Exceptional 67.5% |
| Cambodians | 100.0 /100 | #23 | Exceptional 67.4% |
| Ugandans | 100.0 /100 | #24 | Exceptional 67.4% |
| Immigrants | Africa | 100.0 /100 | #25 | Exceptional 67.4% |
| Immigrants | Cabo Verde | 100.0 /100 | #26 | Exceptional 67.3% |
| Zimbabweans | 100.0 /100 | #27 | Exceptional 67.3% |