Yakama vs Immigrants from Australia In Labor Force | Age 35-44
COMPARE
Yakama
Immigrants from Australia
In Labor Force | Age 35-44
In Labor Force | Age 35-44 Comparison
Yakama
Immigrants from Australia
79.0%
IN LABOR FORCE | AGE 35-44
0.0/ 100
METRIC RATING
334th/ 347
METRIC RANK
84.8%
IN LABOR FORCE | AGE 35-44
95.5/ 100
METRIC RATING
101st/ 347
METRIC RANK
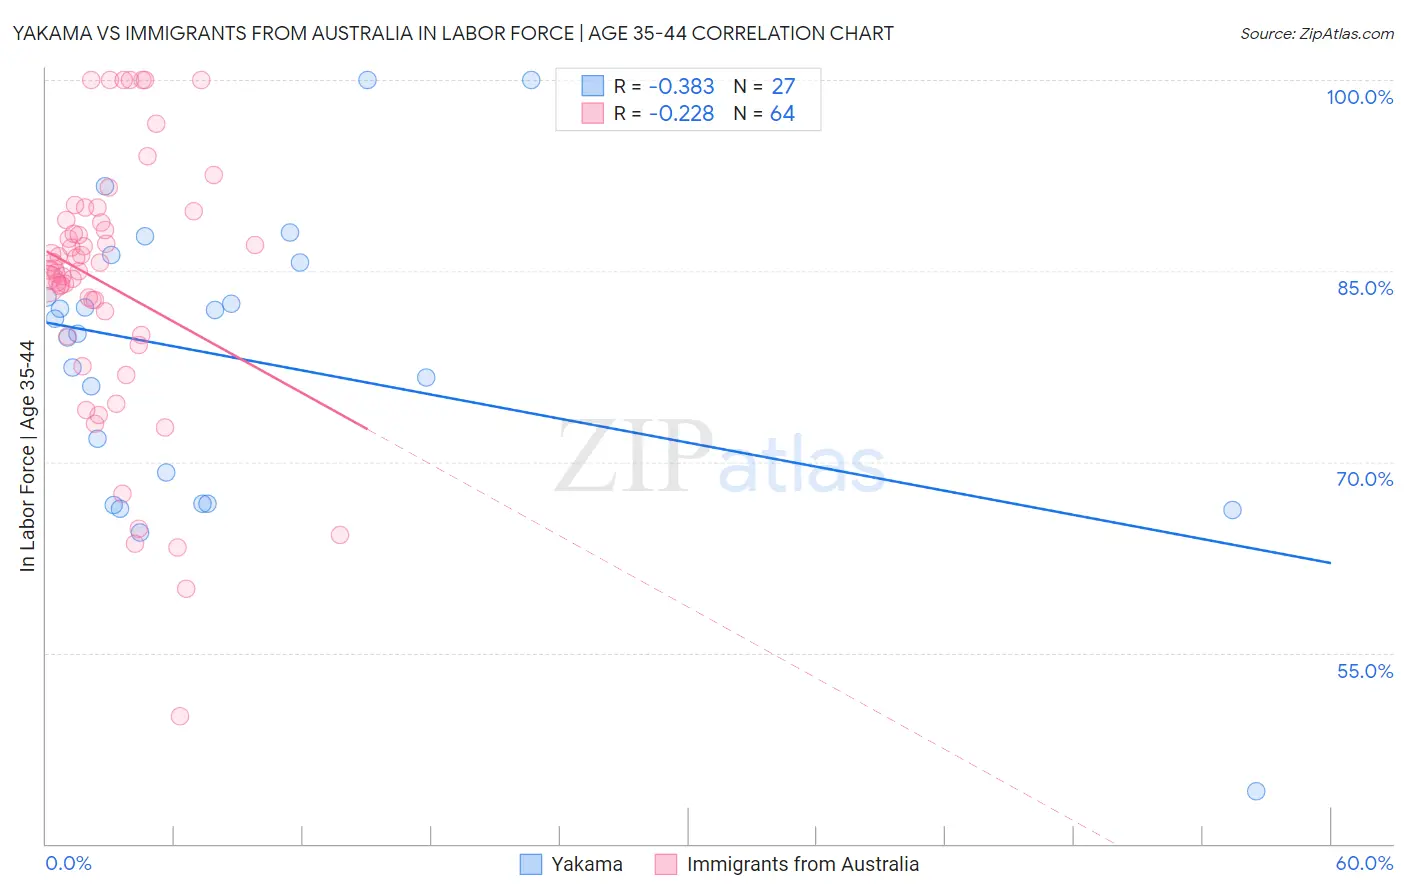
Yakama vs Immigrants from Australia In Labor Force | Age 35-44 Correlation Chart
The statistical analysis conducted on geographies consisting of 19,917,241 people shows a mild negative correlation between the proportion of Yakama and labor force participation rate among population between the ages 35 and 44 in the United States with a correlation coefficient (R) of -0.383 and weighted average of 79.0%. Similarly, the statistical analysis conducted on geographies consisting of 227,176,760 people shows a weak negative correlation between the proportion of Immigrants from Australia and labor force participation rate among population between the ages 35 and 44 in the United States with a correlation coefficient (R) of -0.228 and weighted average of 84.8%, a difference of 7.4%.
In Labor Force | Age 35-44 Correlation Summary
| Measurement | Yakama | Immigrants from Australia |
| Minimum | 44.1% | 50.0% |
| Maximum | 100.0% | 100.0% |
| Range | 55.9% | 50.0% |
| Mean | 77.9% | 83.8% |
| Median | 80.1% | 85.1% |
| Interquartile 25% (IQ1) | 66.7% | 79.9% |
| Interquartile 75% (IQ3) | 85.7% | 88.9% |
| Interquartile Range (IQR) | 19.0% | 9.0% |
| Standard Deviation (Sample) | 11.9% | 10.4% |
| Standard Deviation (Population) | 11.7% | 10.3% |
Similar Demographics by In Labor Force | Age 35-44
Demographics Similar to Yakama by In Labor Force | Age 35-44
In terms of in labor force | age 35-44, the demographic groups most similar to Yakama are Native/Alaskan (78.9%, a difference of 0.11%), Kiowa (79.2%, a difference of 0.29%), Ute (79.4%, a difference of 0.62%), Houma (79.5%, a difference of 0.68%), and Cheyenne (79.5%, a difference of 0.70%).
| Demographics | Rating | Rank | In Labor Force | Age 35-44 |
| Sioux | 0.0 /100 | #327 | Tragic 80.2% |
| Creek | 0.0 /100 | #328 | Tragic 80.0% |
| Menominee | 0.0 /100 | #329 | Tragic 79.7% |
| Cheyenne | 0.0 /100 | #330 | Tragic 79.5% |
| Houma | 0.0 /100 | #331 | Tragic 79.5% |
| Ute | 0.0 /100 | #332 | Tragic 79.4% |
| Kiowa | 0.0 /100 | #333 | Tragic 79.2% |
| Yakama | 0.0 /100 | #334 | Tragic 79.0% |
| Natives/Alaskans | 0.0 /100 | #335 | Tragic 78.9% |
| Arapaho | 0.0 /100 | #336 | Tragic 78.1% |
| Apache | 0.0 /100 | #337 | Tragic 77.9% |
| Pueblo | 0.0 /100 | #338 | Tragic 77.4% |
| Yup'ik | 0.0 /100 | #339 | Tragic 77.3% |
| Lumbee | 0.0 /100 | #340 | Tragic 77.0% |
| Hopi | 0.0 /100 | #341 | Tragic 77.0% |
Demographics Similar to Immigrants from Australia by In Labor Force | Age 35-44
In terms of in labor force | age 35-44, the demographic groups most similar to Immigrants from Australia are Immigrants from Czechoslovakia (84.8%, a difference of 0.010%), Immigrants from Southern Europe (84.8%, a difference of 0.010%), Immigrants from Belarus (84.8%, a difference of 0.010%), Immigrants from Sweden (84.8%, a difference of 0.010%), and Indian (Asian) (84.8%, a difference of 0.020%).
| Demographics | Rating | Rank | In Labor Force | Age 35-44 |
| Mongolians | 96.8 /100 | #94 | Exceptional 84.8% |
| Immigrants | Kuwait | 96.7 /100 | #95 | Exceptional 84.8% |
| Cubans | 96.6 /100 | #96 | Exceptional 84.8% |
| Egyptians | 96.6 /100 | #97 | Exceptional 84.8% |
| Indians (Asian) | 96.1 /100 | #98 | Exceptional 84.8% |
| Haitians | 96.0 /100 | #99 | Exceptional 84.8% |
| Immigrants | Czechoslovakia | 95.9 /100 | #100 | Exceptional 84.8% |
| Immigrants | Australia | 95.5 /100 | #101 | Exceptional 84.8% |
| Immigrants | Southern Europe | 95.3 /100 | #102 | Exceptional 84.8% |
| Immigrants | Belarus | 95.3 /100 | #103 | Exceptional 84.8% |
| Immigrants | Sweden | 95.2 /100 | #104 | Exceptional 84.8% |
| South Americans | 95.0 /100 | #105 | Exceptional 84.8% |
| Immigrants | Bahamas | 94.8 /100 | #106 | Exceptional 84.8% |
| Immigrants | Romania | 94.7 /100 | #107 | Exceptional 84.8% |
| Immigrants | Argentina | 94.5 /100 | #108 | Exceptional 84.8% |