Immigrants from Turkey vs Immigrants from Australia In Labor Force | Age 35-44
COMPARE
Immigrants from Turkey
Immigrants from Australia
In Labor Force | Age 35-44
In Labor Force | Age 35-44 Comparison
Immigrants from Turkey
Immigrants from Australia
84.9%
IN LABOR FORCE | AGE 35-44
98.6/ 100
METRIC RATING
77th/ 347
METRIC RANK
84.8%
IN LABOR FORCE | AGE 35-44
95.5/ 100
METRIC RATING
101st/ 347
METRIC RANK
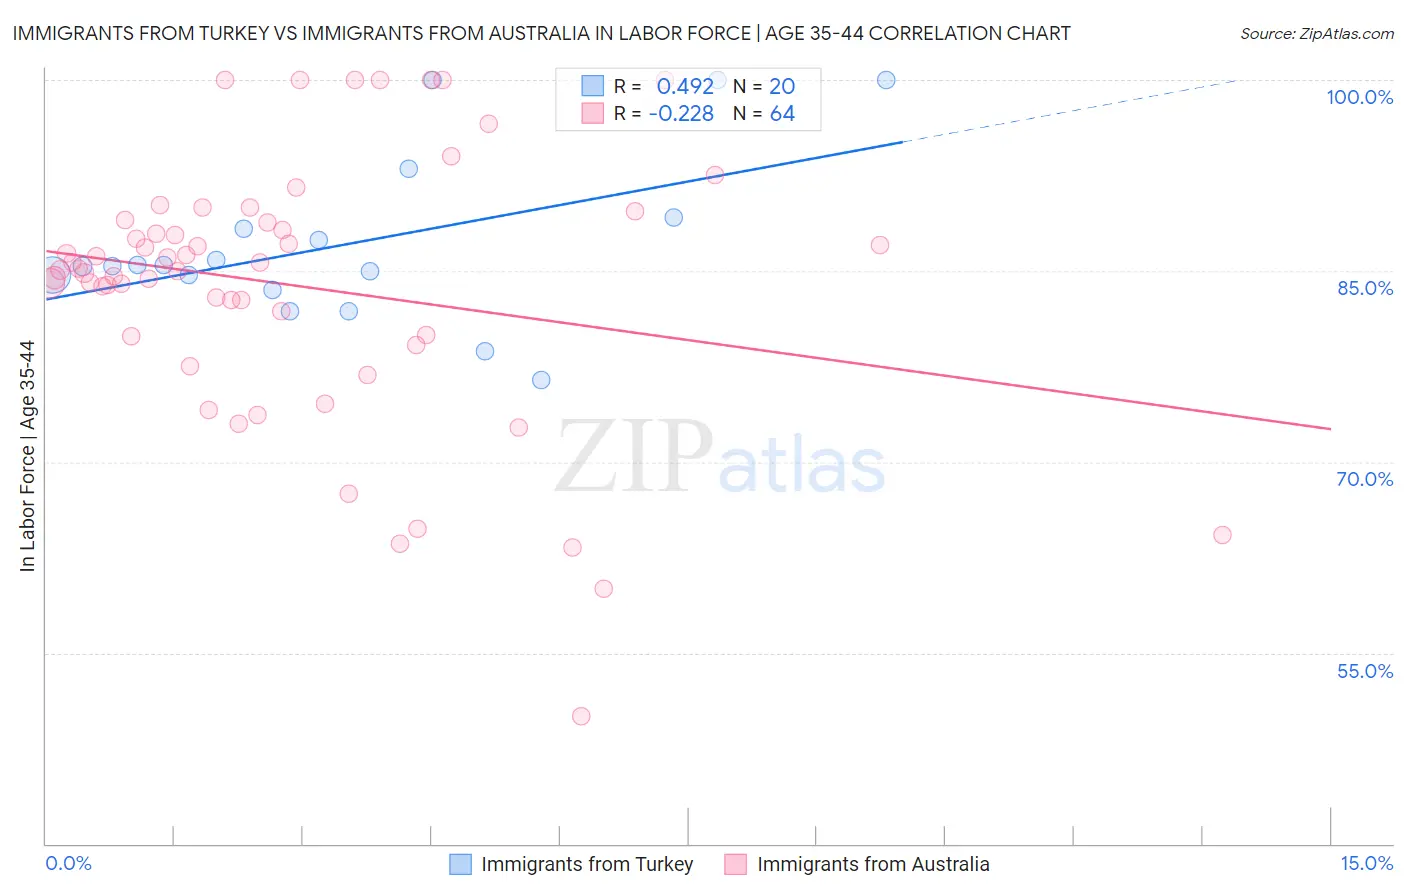
Immigrants from Turkey vs Immigrants from Australia In Labor Force | Age 35-44 Correlation Chart
The statistical analysis conducted on geographies consisting of 222,985,945 people shows a moderate positive correlation between the proportion of Immigrants from Turkey and labor force participation rate among population between the ages 35 and 44 in the United States with a correlation coefficient (R) of 0.492 and weighted average of 84.9%. Similarly, the statistical analysis conducted on geographies consisting of 227,176,760 people shows a weak negative correlation between the proportion of Immigrants from Australia and labor force participation rate among population between the ages 35 and 44 in the United States with a correlation coefficient (R) of -0.228 and weighted average of 84.8%, a difference of 0.19%.
In Labor Force | Age 35-44 Correlation Summary
| Measurement | Immigrants from Turkey | Immigrants from Australia |
| Minimum | 76.4% | 50.0% |
| Maximum | 100.0% | 100.0% |
| Range | 23.6% | 50.0% |
| Mean | 87.1% | 83.8% |
| Median | 85.4% | 85.1% |
| Interquartile 25% (IQ1) | 84.1% | 79.9% |
| Interquartile 75% (IQ3) | 88.8% | 88.9% |
| Interquartile Range (IQR) | 4.7% | 9.0% |
| Standard Deviation (Sample) | 6.6% | 10.4% |
| Standard Deviation (Population) | 6.4% | 10.3% |
Similar Demographics by In Labor Force | Age 35-44
Demographics Similar to Immigrants from Turkey by In Labor Force | Age 35-44
In terms of in labor force | age 35-44, the demographic groups most similar to Immigrants from Turkey are Immigrants from Cuba (84.9%, a difference of 0.0%), Immigrants from South Central Asia (85.0%, a difference of 0.010%), Colombian (85.0%, a difference of 0.020%), Immigrants from Singapore (85.0%, a difference of 0.030%), and Immigrants from Sri Lanka (85.0%, a difference of 0.030%).
| Demographics | Rating | Rank | In Labor Force | Age 35-44 |
| Brazilians | 99.0 /100 | #70 | Exceptional 85.0% |
| Russians | 99.0 /100 | #71 | Exceptional 85.0% |
| Immigrants | Singapore | 98.9 /100 | #72 | Exceptional 85.0% |
| Immigrants | Sri Lanka | 98.9 /100 | #73 | Exceptional 85.0% |
| Colombians | 98.8 /100 | #74 | Exceptional 85.0% |
| Immigrants | South Central Asia | 98.7 /100 | #75 | Exceptional 85.0% |
| Immigrants | Cuba | 98.6 /100 | #76 | Exceptional 84.9% |
| Immigrants | Turkey | 98.6 /100 | #77 | Exceptional 84.9% |
| Immigrants | Africa | 98.4 /100 | #78 | Exceptional 84.9% |
| Peruvians | 98.3 /100 | #79 | Exceptional 84.9% |
| Immigrants | Colombia | 98.3 /100 | #80 | Exceptional 84.9% |
| Immigrants | Eastern Europe | 98.3 /100 | #81 | Exceptional 84.9% |
| Immigrants | Sudan | 98.1 /100 | #82 | Exceptional 84.9% |
| Senegalese | 97.8 /100 | #83 | Exceptional 84.9% |
| Immigrants | Peru | 97.8 /100 | #84 | Exceptional 84.9% |
Demographics Similar to Immigrants from Australia by In Labor Force | Age 35-44
In terms of in labor force | age 35-44, the demographic groups most similar to Immigrants from Australia are Immigrants from Czechoslovakia (84.8%, a difference of 0.010%), Immigrants from Southern Europe (84.8%, a difference of 0.010%), Immigrants from Belarus (84.8%, a difference of 0.010%), Immigrants from Sweden (84.8%, a difference of 0.010%), and Indian (Asian) (84.8%, a difference of 0.020%).
| Demographics | Rating | Rank | In Labor Force | Age 35-44 |
| Mongolians | 96.8 /100 | #94 | Exceptional 84.8% |
| Immigrants | Kuwait | 96.7 /100 | #95 | Exceptional 84.8% |
| Cubans | 96.6 /100 | #96 | Exceptional 84.8% |
| Egyptians | 96.6 /100 | #97 | Exceptional 84.8% |
| Indians (Asian) | 96.1 /100 | #98 | Exceptional 84.8% |
| Haitians | 96.0 /100 | #99 | Exceptional 84.8% |
| Immigrants | Czechoslovakia | 95.9 /100 | #100 | Exceptional 84.8% |
| Immigrants | Australia | 95.5 /100 | #101 | Exceptional 84.8% |
| Immigrants | Southern Europe | 95.3 /100 | #102 | Exceptional 84.8% |
| Immigrants | Belarus | 95.3 /100 | #103 | Exceptional 84.8% |
| Immigrants | Sweden | 95.2 /100 | #104 | Exceptional 84.8% |
| South Americans | 95.0 /100 | #105 | Exceptional 84.8% |
| Immigrants | Bahamas | 94.8 /100 | #106 | Exceptional 84.8% |
| Immigrants | Romania | 94.7 /100 | #107 | Exceptional 84.8% |
| Immigrants | Argentina | 94.5 /100 | #108 | Exceptional 84.8% |