Immigrants from Panama vs Portuguese In Labor Force | Age 20-24
COMPARE
Immigrants from Panama
Portuguese
In Labor Force | Age 20-24
In Labor Force | Age 20-24 Comparison
Immigrants from Panama
Portuguese
73.9%
IN LABOR FORCE | AGE 20-24
1.6/ 100
METRIC RATING
246th/ 347
METRIC RANK
76.4%
IN LABOR FORCE | AGE 20-24
99.3/ 100
METRIC RATING
85th/ 347
METRIC RANK
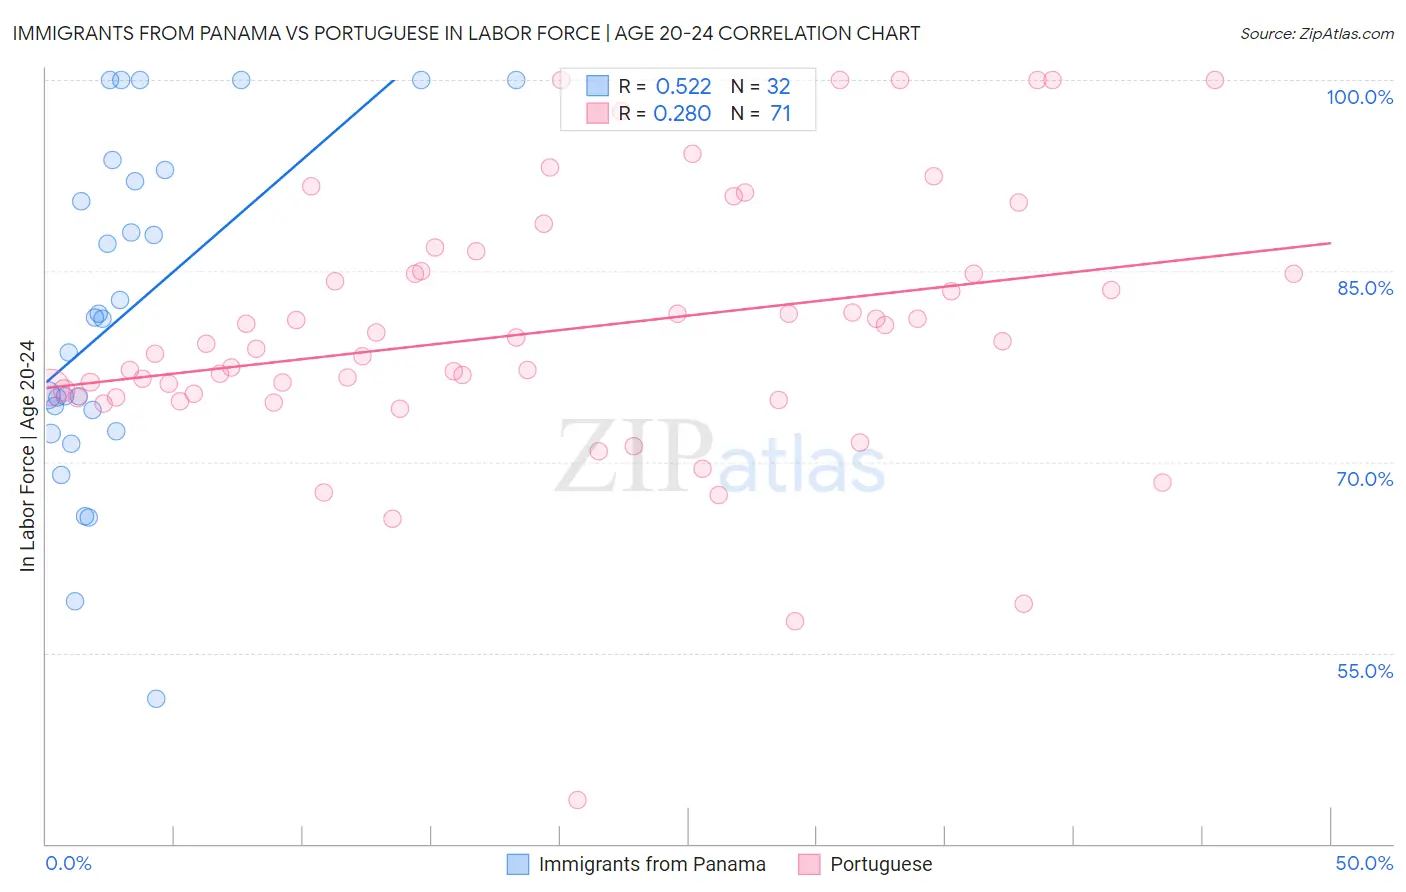
Immigrants from Panama vs Portuguese In Labor Force | Age 20-24 Correlation Chart
The statistical analysis conducted on geographies consisting of 221,162,979 people shows a substantial positive correlation between the proportion of Immigrants from Panama and labor force participation rate among population between the ages 20 and 24 in the United States with a correlation coefficient (R) of 0.522 and weighted average of 73.9%. Similarly, the statistical analysis conducted on geographies consisting of 449,964,136 people shows a weak positive correlation between the proportion of Portuguese and labor force participation rate among population between the ages 20 and 24 in the United States with a correlation coefficient (R) of 0.280 and weighted average of 76.4%, a difference of 3.4%.
In Labor Force | Age 20-24 Correlation Summary
| Measurement | Immigrants from Panama | Portuguese |
| Minimum | 51.4% | 43.4% |
| Maximum | 100.0% | 100.0% |
| Range | 48.6% | 56.6% |
| Mean | 81.7% | 80.3% |
| Median | 81.3% | 79.3% |
| Interquartile 25% (IQ1) | 73.3% | 75.0% |
| Interquartile 75% (IQ3) | 92.4% | 85.0% |
| Interquartile Range (IQR) | 19.2% | 10.0% |
| Standard Deviation (Sample) | 13.0% | 10.5% |
| Standard Deviation (Population) | 12.8% | 10.4% |
Similar Demographics by In Labor Force | Age 20-24
Demographics Similar to Immigrants from Panama by In Labor Force | Age 20-24
In terms of in labor force | age 20-24, the demographic groups most similar to Immigrants from Panama are Colville (73.9%, a difference of 0.030%), Immigrants from Saudi Arabia (73.9%, a difference of 0.030%), Turkish (73.9%, a difference of 0.040%), Immigrants from South Central Asia (74.0%, a difference of 0.060%), and Immigrants from Syria (74.0%, a difference of 0.070%).
| Demographics | Rating | Rank | In Labor Force | Age 20-24 |
| Immigrants | Latin America | 2.7 /100 | #239 | Tragic 74.1% |
| Immigrants | Sri Lanka | 2.3 /100 | #240 | Tragic 74.0% |
| Immigrants | Senegal | 2.1 /100 | #241 | Tragic 74.0% |
| Thais | 2.1 /100 | #242 | Tragic 74.0% |
| Immigrants | Syria | 1.9 /100 | #243 | Tragic 74.0% |
| Immigrants | South Central Asia | 1.9 /100 | #244 | Tragic 74.0% |
| Turks | 1.8 /100 | #245 | Tragic 73.9% |
| Immigrants | Panama | 1.6 /100 | #246 | Tragic 73.9% |
| Colville | 1.5 /100 | #247 | Tragic 73.9% |
| Immigrants | Saudi Arabia | 1.5 /100 | #248 | Tragic 73.9% |
| Blacks/African Americans | 1.3 /100 | #249 | Tragic 73.9% |
| Immigrants | Belgium | 1.3 /100 | #250 | Tragic 73.9% |
| Immigrants | Egypt | 1.2 /100 | #251 | Tragic 73.8% |
| Immigrants | Kazakhstan | 1.1 /100 | #252 | Tragic 73.8% |
| Arapaho | 1.0 /100 | #253 | Tragic 73.8% |
Demographics Similar to Portuguese by In Labor Force | Age 20-24
In terms of in labor force | age 20-24, the demographic groups most similar to Portuguese are Austrian (76.5%, a difference of 0.030%), Immigrants from Iraq (76.4%, a difference of 0.030%), Immigrants from Thailand (76.4%, a difference of 0.030%), Carpatho Rusyn (76.5%, a difference of 0.040%), and Spanish (76.4%, a difference of 0.070%).
| Demographics | Rating | Rank | In Labor Force | Age 20-24 |
| Canadians | 99.6 /100 | #78 | Exceptional 76.6% |
| Immigrants | Zaire | 99.6 /100 | #79 | Exceptional 76.6% |
| Italians | 99.6 /100 | #80 | Exceptional 76.5% |
| Basques | 99.5 /100 | #81 | Exceptional 76.5% |
| Hmong | 99.5 /100 | #82 | Exceptional 76.5% |
| Carpatho Rusyns | 99.4 /100 | #83 | Exceptional 76.5% |
| Austrians | 99.4 /100 | #84 | Exceptional 76.5% |
| Portuguese | 99.3 /100 | #85 | Exceptional 76.4% |
| Immigrants | Iraq | 99.3 /100 | #86 | Exceptional 76.4% |
| Immigrants | Thailand | 99.3 /100 | #87 | Exceptional 76.4% |
| Spanish | 99.2 /100 | #88 | Exceptional 76.4% |
| Bulgarians | 99.2 /100 | #89 | Exceptional 76.4% |
| Immigrants | Burma/Myanmar | 99.1 /100 | #90 | Exceptional 76.3% |
| Sierra Leoneans | 99.0 /100 | #91 | Exceptional 76.3% |
| Maltese | 98.9 /100 | #92 | Exceptional 76.3% |