White/Caucasian vs Immigrants from Asia In Labor Force | Age 16-19
COMPARE
White/Caucasian
Immigrants from Asia
In Labor Force | Age 16-19
In Labor Force | Age 16-19 Comparison
Whites/Caucasians
Immigrants from Asia
41.3%
IN LABOR FORCE | AGE 16-19
100.0/ 100
METRIC RATING
42nd/ 347
METRIC RANK
34.1%
IN LABOR FORCE | AGE 16-19
0.5/ 100
METRIC RATING
268th/ 347
METRIC RANK
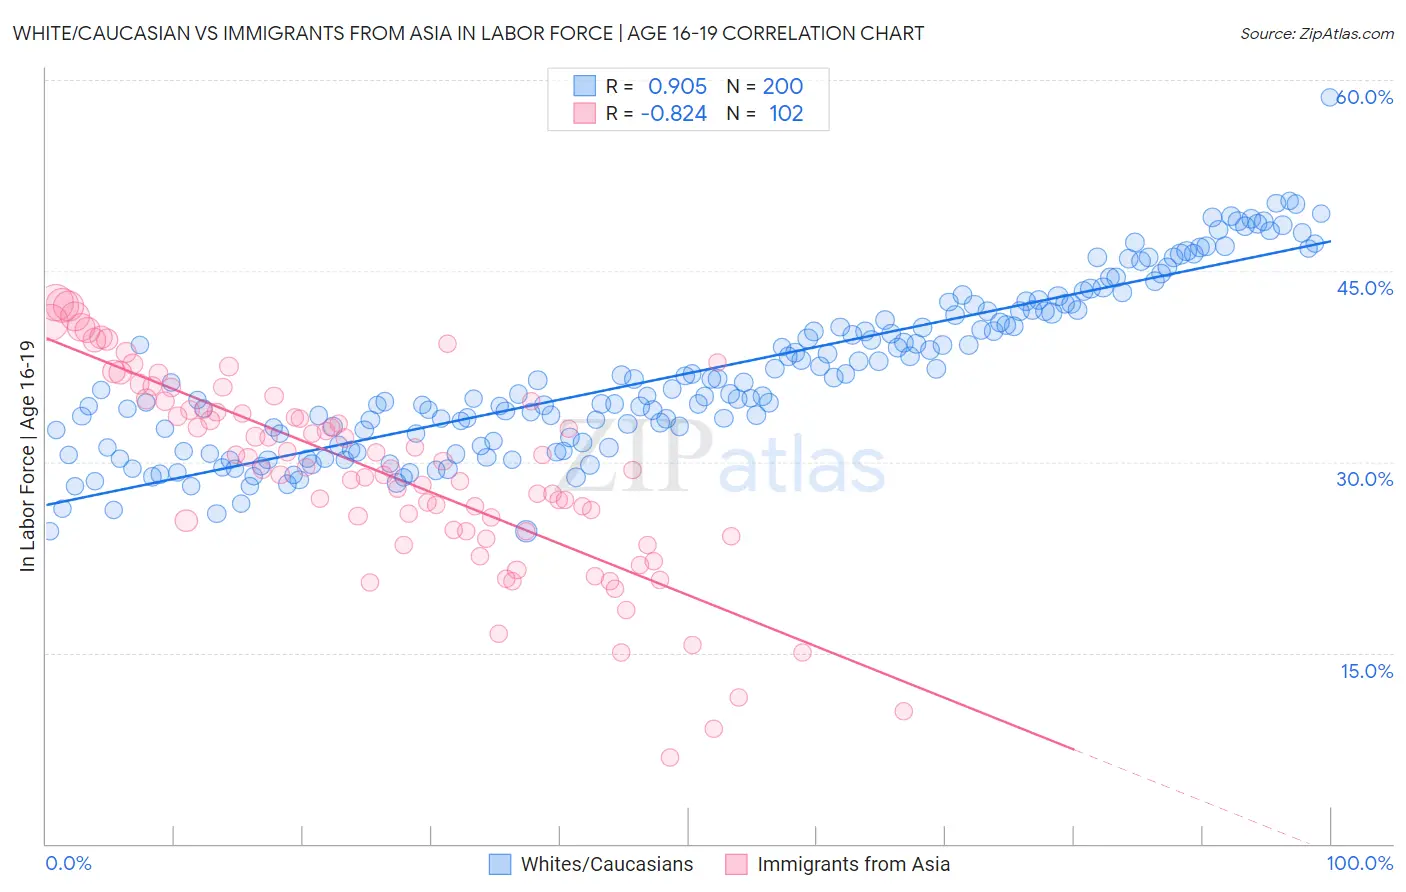
White/Caucasian vs Immigrants from Asia In Labor Force | Age 16-19 Correlation Chart
The statistical analysis conducted on geographies consisting of 578,396,700 people shows a near-perfect positive correlation between the proportion of Whites/Caucasians and labor force participation rate among population between the ages 16 and 19 in the United States with a correlation coefficient (R) of 0.905 and weighted average of 41.3%. Similarly, the statistical analysis conducted on geographies consisting of 546,796,983 people shows a very strong negative correlation between the proportion of Immigrants from Asia and labor force participation rate among population between the ages 16 and 19 in the United States with a correlation coefficient (R) of -0.824 and weighted average of 34.1%, a difference of 21.1%.
In Labor Force | Age 16-19 Correlation Summary
| Measurement | White/Caucasian | Immigrants from Asia |
| Minimum | 24.5% | 6.8% |
| Maximum | 58.6% | 42.5% |
| Range | 34.1% | 35.7% |
| Mean | 37.0% | 29.2% |
| Median | 35.4% | 29.5% |
| Interquartile 25% (IQ1) | 31.4% | 24.5% |
| Interquartile 75% (IQ3) | 41.8% | 34.7% |
| Interquartile Range (IQR) | 10.5% | 10.2% |
| Standard Deviation (Sample) | 6.6% | 7.7% |
| Standard Deviation (Population) | 6.6% | 7.7% |
Similar Demographics by In Labor Force | Age 16-19
Demographics Similar to Whites/Caucasians by In Labor Force | Age 16-19
In terms of in labor force | age 16-19, the demographic groups most similar to Whites/Caucasians are Celtic (41.3%, a difference of 0.010%), Tongan (41.2%, a difference of 0.30%), Immigrants from Liberia (41.5%, a difference of 0.35%), European (41.1%, a difference of 0.41%), and Scotch-Irish (41.5%, a difference of 0.45%).
| Demographics | Rating | Rank | In Labor Force | Age 16-19 |
| Yugoslavians | 100.0 /100 | #35 | Exceptional 41.8% |
| Immigrants | Azores | 100.0 /100 | #36 | Exceptional 41.7% |
| Immigrants | Congo | 100.0 /100 | #37 | Exceptional 41.7% |
| Sioux | 100.0 /100 | #38 | Exceptional 41.5% |
| Scotch-Irish | 100.0 /100 | #39 | Exceptional 41.5% |
| Immigrants | Liberia | 100.0 /100 | #40 | Exceptional 41.5% |
| Celtics | 100.0 /100 | #41 | Exceptional 41.3% |
| Whites/Caucasians | 100.0 /100 | #42 | Exceptional 41.3% |
| Tongans | 100.0 /100 | #43 | Exceptional 41.2% |
| Europeans | 100.0 /100 | #44 | Exceptional 41.1% |
| Croatians | 100.0 /100 | #45 | Exceptional 41.1% |
| Immigrants | Sudan | 100.0 /100 | #46 | Exceptional 41.0% |
| Carpatho Rusyns | 100.0 /100 | #47 | Exceptional 40.8% |
| Icelanders | 100.0 /100 | #48 | Exceptional 40.8% |
| Cree | 100.0 /100 | #49 | Exceptional 40.8% |
Demographics Similar to Immigrants from Asia by In Labor Force | Age 16-19
In terms of in labor force | age 16-19, the demographic groups most similar to Immigrants from Asia are Pima (34.1%, a difference of 0.080%), Immigrants from Peru (34.2%, a difference of 0.12%), Immigrants from Russia (34.1%, a difference of 0.13%), Central American Indian (34.1%, a difference of 0.13%), and Asian (34.1%, a difference of 0.16%).
| Demographics | Rating | Rank | In Labor Force | Age 16-19 |
| Salvadorans | 1.1 /100 | #261 | Tragic 34.5% |
| Hispanics or Latinos | 1.1 /100 | #262 | Tragic 34.5% |
| Burmese | 1.1 /100 | #263 | Tragic 34.5% |
| Immigrants | Uruguay | 0.9 /100 | #264 | Tragic 34.4% |
| Immigrants | El Salvador | 0.7 /100 | #265 | Tragic 34.3% |
| Immigrants | Malaysia | 0.7 /100 | #266 | Tragic 34.3% |
| Immigrants | Peru | 0.5 /100 | #267 | Tragic 34.2% |
| Immigrants | Asia | 0.5 /100 | #268 | Tragic 34.1% |
| Pima | 0.5 /100 | #269 | Tragic 34.1% |
| Immigrants | Russia | 0.4 /100 | #270 | Tragic 34.1% |
| Central American Indians | 0.4 /100 | #271 | Tragic 34.1% |
| Asians | 0.4 /100 | #272 | Tragic 34.1% |
| Immigrants | Panama | 0.4 /100 | #273 | Tragic 34.0% |
| Venezuelans | 0.3 /100 | #274 | Tragic 34.0% |
| Immigrants | Fiji | 0.3 /100 | #275 | Tragic 33.9% |