White/Caucasian vs Danish In Labor Force | Age 30-34
COMPARE
White/Caucasian
Danish
In Labor Force | Age 30-34
In Labor Force | Age 30-34 Comparison
Whites/Caucasians
Danes
83.9%
IN LABOR FORCE | AGE 30-34
0.5/ 100
METRIC RATING
255th/ 347
METRIC RANK
84.3%
IN LABOR FORCE | AGE 30-34
5.3/ 100
METRIC RATING
220th/ 347
METRIC RANK
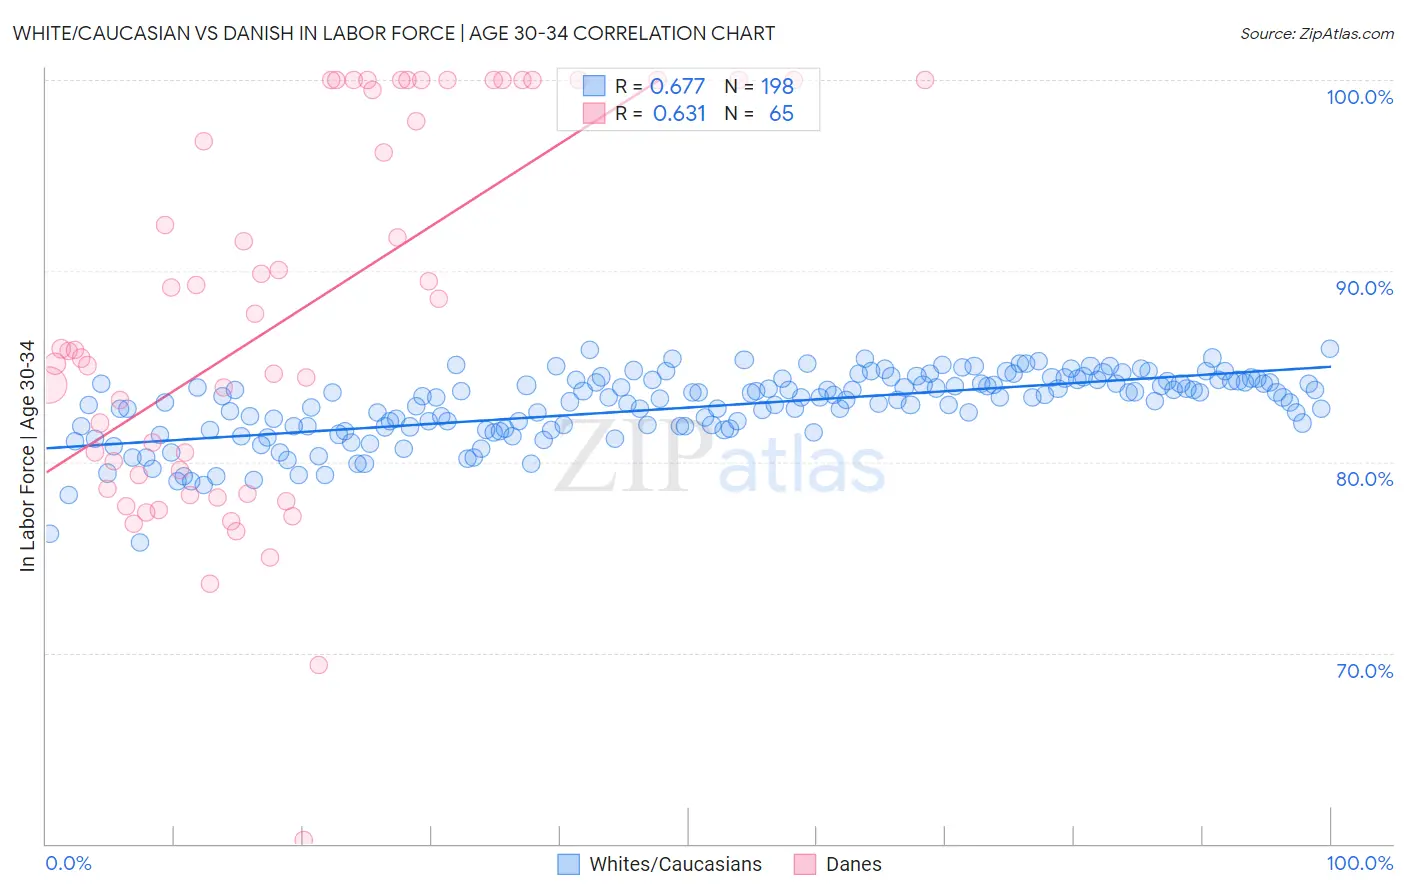
White/Caucasian vs Danish In Labor Force | Age 30-34 Correlation Chart
The statistical analysis conducted on geographies consisting of 582,394,774 people shows a significant positive correlation between the proportion of Whites/Caucasians and labor force participation rate among population between the ages 30 and 34 in the United States with a correlation coefficient (R) of 0.677 and weighted average of 83.9%. Similarly, the statistical analysis conducted on geographies consisting of 473,662,566 people shows a significant positive correlation between the proportion of Danes and labor force participation rate among population between the ages 30 and 34 in the United States with a correlation coefficient (R) of 0.631 and weighted average of 84.3%, a difference of 0.44%.
In Labor Force | Age 30-34 Correlation Summary
| Measurement | White/Caucasian | Danish |
| Minimum | 75.8% | 60.2% |
| Maximum | 85.9% | 100.0% |
| Range | 10.2% | 39.8% |
| Mean | 82.9% | 87.6% |
| Median | 83.4% | 85.8% |
| Interquartile 25% (IQ1) | 81.8% | 79.0% |
| Interquartile 75% (IQ3) | 84.2% | 100.0% |
| Interquartile Range (IQR) | 2.4% | 21.0% |
| Standard Deviation (Sample) | 1.8% | 9.8% |
| Standard Deviation (Population) | 1.8% | 9.8% |
Similar Demographics by In Labor Force | Age 30-34
Demographics Similar to Whites/Caucasians by In Labor Force | Age 30-34
In terms of in labor force | age 30-34, the demographic groups most similar to Whites/Caucasians are Immigrants from St. Vincent and the Grenadines (83.9%, a difference of 0.020%), Nicaraguan (83.9%, a difference of 0.040%), Bahamian (83.9%, a difference of 0.040%), Immigrants from Nicaragua (83.9%, a difference of 0.040%), and Immigrants from Lebanon (83.9%, a difference of 0.040%).
| Demographics | Rating | Rank | In Labor Force | Age 30-34 |
| Portuguese | 0.8 /100 | #248 | Tragic 84.0% |
| Immigrants | Dominica | 0.7 /100 | #249 | Tragic 84.0% |
| Immigrants | Iraq | 0.7 /100 | #250 | Tragic 83.9% |
| Nicaraguans | 0.6 /100 | #251 | Tragic 83.9% |
| Bahamians | 0.6 /100 | #252 | Tragic 83.9% |
| Immigrants | Nicaragua | 0.6 /100 | #253 | Tragic 83.9% |
| Immigrants | St. Vincent and the Grenadines | 0.5 /100 | #254 | Tragic 83.9% |
| Whites/Caucasians | 0.5 /100 | #255 | Tragic 83.9% |
| Immigrants | Lebanon | 0.4 /100 | #256 | Tragic 83.9% |
| Iraqis | 0.3 /100 | #257 | Tragic 83.8% |
| Hondurans | 0.3 /100 | #258 | Tragic 83.8% |
| Scotch-Irish | 0.3 /100 | #259 | Tragic 83.8% |
| Immigrants | Dominican Republic | 0.3 /100 | #260 | Tragic 83.8% |
| Guyanese | 0.3 /100 | #261 | Tragic 83.8% |
| Dominicans | 0.2 /100 | #262 | Tragic 83.8% |
Demographics Similar to Danes by In Labor Force | Age 30-34
In terms of in labor force | age 30-34, the demographic groups most similar to Danes are Swiss (84.3%, a difference of 0.020%), Immigrants from Panama (84.3%, a difference of 0.030%), Immigrants from Trinidad and Tobago (84.3%, a difference of 0.050%), Immigrants from Germany (84.3%, a difference of 0.060%), and European (84.3%, a difference of 0.060%).
| Demographics | Rating | Rank | In Labor Force | Age 30-34 |
| Immigrants | Jamaica | 7.9 /100 | #213 | Tragic 84.3% |
| Immigrants | Germany | 7.2 /100 | #214 | Tragic 84.3% |
| Europeans | 7.2 /100 | #215 | Tragic 84.3% |
| Immigrants | Ecuador | 7.1 /100 | #216 | Tragic 84.3% |
| Immigrants | Trinidad and Tobago | 7.0 /100 | #217 | Tragic 84.3% |
| Immigrants | Panama | 6.3 /100 | #218 | Tragic 84.3% |
| Swiss | 5.8 /100 | #219 | Tragic 84.3% |
| Danes | 5.3 /100 | #220 | Tragic 84.3% |
| Salvadorans | 3.8 /100 | #221 | Tragic 84.2% |
| Panamanians | 3.8 /100 | #222 | Tragic 84.2% |
| Immigrants | Laos | 3.6 /100 | #223 | Tragic 84.2% |
| Cubans | 3.4 /100 | #224 | Tragic 84.2% |
| Scottish | 3.1 /100 | #225 | Tragic 84.2% |
| Immigrants | El Salvador | 3.0 /100 | #226 | Tragic 84.2% |
| Immigrants | Cuba | 3.0 /100 | #227 | Tragic 84.2% |