West Indian vs Ecuadorian Median Family Income
COMPARE
West Indian
Ecuadorian
Median Family Income
Median Family Income Comparison
West Indians
Ecuadorians
$92,765
MEDIAN FAMILY INCOME
0.6/ 100
METRIC RATING
250th/ 347
METRIC RANK
$95,114
MEDIAN FAMILY INCOME
2.1/ 100
METRIC RATING
231st/ 347
METRIC RANK
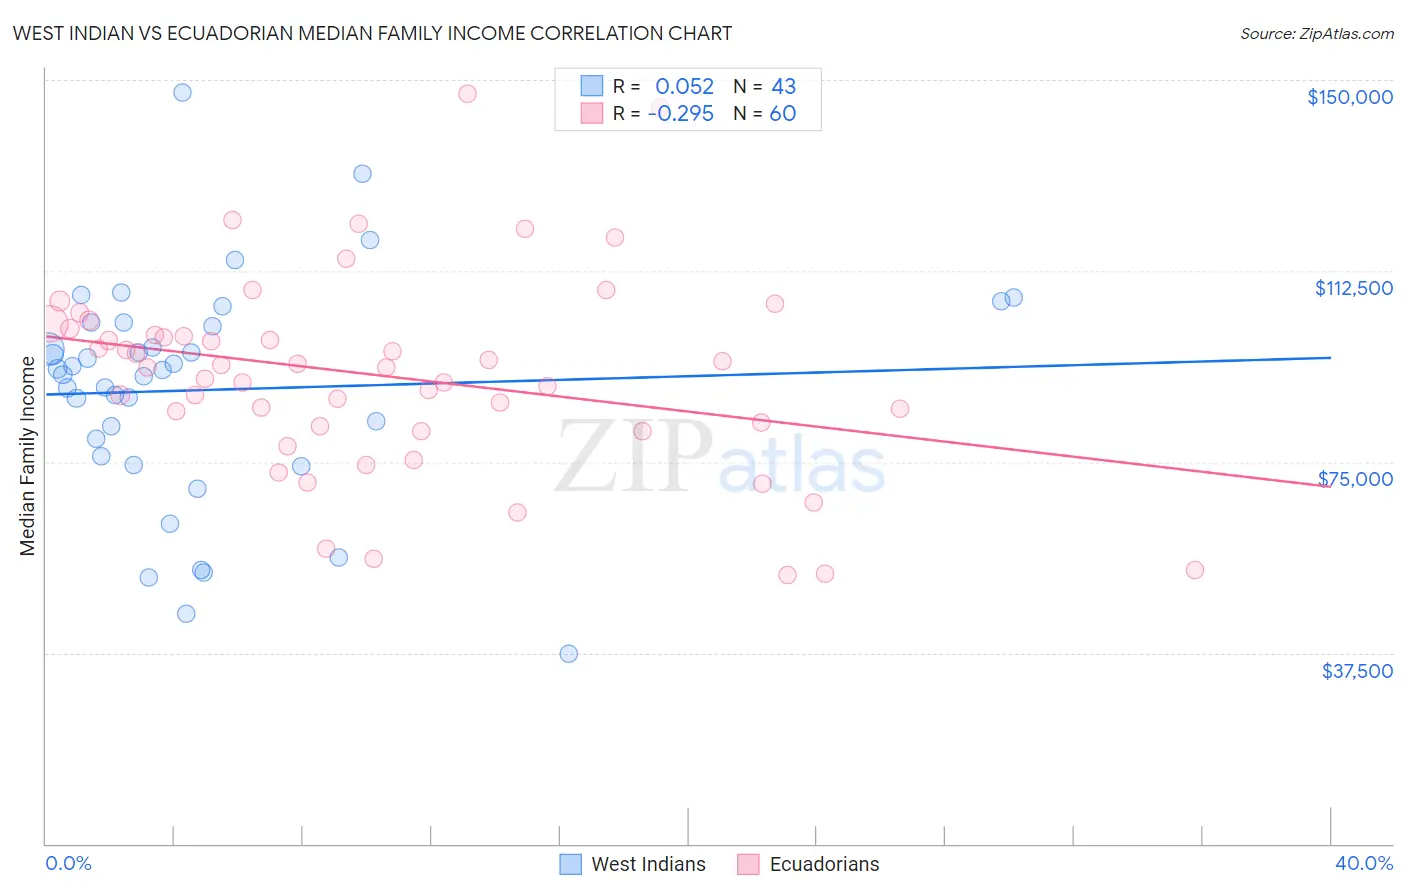
West Indian vs Ecuadorian Median Family Income Correlation Chart
The statistical analysis conducted on geographies consisting of 253,786,025 people shows a slight positive correlation between the proportion of West Indians and median family income in the United States with a correlation coefficient (R) of 0.052 and weighted average of $92,765. Similarly, the statistical analysis conducted on geographies consisting of 317,539,775 people shows a weak negative correlation between the proportion of Ecuadorians and median family income in the United States with a correlation coefficient (R) of -0.295 and weighted average of $95,114, a difference of 2.5%.
Median Family Income Correlation Summary
| Measurement | West Indian | Ecuadorian |
| Minimum | $37,244 | $52,846 |
| Maximum | $147,600 | $147,371 |
| Range | $110,356 | $94,525 |
| Mean | $89,153 | $91,870 |
| Median | $92,948 | $93,530 |
| Interquartile 25% (IQ1) | $76,053 | $81,441 |
| Interquartile 75% (IQ3) | $102,268 | $100,588 |
| Interquartile Range (IQR) | $26,215 | $19,147 |
| Standard Deviation (Sample) | $22,238 | $19,583 |
| Standard Deviation (Population) | $21,978 | $19,420 |
Demographics Similar to West Indians and Ecuadorians by Median Family Income
In terms of median family income, the demographic groups most similar to West Indians are Immigrants from Ecuador ($92,837, a difference of 0.080%), French American Indian ($92,872, a difference of 0.11%), Immigrants from Senegal ($92,912, a difference of 0.16%), Guyanese ($93,373, a difference of 0.66%), and Immigrants from Middle Africa ($93,593, a difference of 0.89%). Similarly, the demographic groups most similar to Ecuadorians are Malaysian ($95,230, a difference of 0.12%), Immigrants from Venezuela ($94,904, a difference of 0.22%), Immigrants from Bangladesh ($94,665, a difference of 0.47%), Immigrants from Western Africa ($94,638, a difference of 0.50%), and Immigrants from Burma/Myanmar ($94,472, a difference of 0.68%).
| Demographics | Rating | Rank | Median Family Income |
| Malaysians | 2.2 /100 | #230 | Tragic $95,230 |
| Ecuadorians | 2.1 /100 | #231 | Tragic $95,114 |
| Immigrants | Venezuela | 1.9 /100 | #232 | Tragic $94,904 |
| Immigrants | Bangladesh | 1.6 /100 | #233 | Tragic $94,665 |
| Immigrants | Western Africa | 1.6 /100 | #234 | Tragic $94,638 |
| Immigrants | Burma/Myanmar | 1.5 /100 | #235 | Tragic $94,472 |
| Trinidadians and Tobagonians | 1.5 /100 | #236 | Tragic $94,466 |
| Alaskan Athabascans | 1.5 /100 | #237 | Tragic $94,429 |
| Nepalese | 1.3 /100 | #238 | Tragic $94,153 |
| Salvadorans | 1.2 /100 | #239 | Tragic $94,109 |
| Somalis | 1.2 /100 | #240 | Tragic $94,085 |
| Immigrants | Trinidad and Tobago | 1.2 /100 | #241 | Tragic $93,988 |
| Barbadians | 1.1 /100 | #242 | Tragic $93,919 |
| German Russians | 1.1 /100 | #243 | Tragic $93,858 |
| Sub-Saharan Africans | 1.0 /100 | #244 | Tragic $93,748 |
| Immigrants | Middle Africa | 1.0 /100 | #245 | Tragic $93,593 |
| Guyanese | 0.9 /100 | #246 | Tragic $93,373 |
| Immigrants | Senegal | 0.7 /100 | #247 | Tragic $92,912 |
| French American Indians | 0.7 /100 | #248 | Tragic $92,872 |
| Immigrants | Ecuador | 0.7 /100 | #249 | Tragic $92,837 |
| West Indians | 0.6 /100 | #250 | Tragic $92,765 |