Romanian vs Assyrian/Chaldean/Syriac In Labor Force | Age 16-19
COMPARE
Romanian
Assyrian/Chaldean/Syriac
In Labor Force | Age 16-19
In Labor Force | Age 16-19 Comparison
Romanians
Assyrians/Chaldeans/Syriacs
37.5%
IN LABOR FORCE | AGE 16-19
87.3/ 100
METRIC RATING
148th/ 347
METRIC RANK
38.3%
IN LABOR FORCE | AGE 16-19
97.8/ 100
METRIC RATING
119th/ 347
METRIC RANK
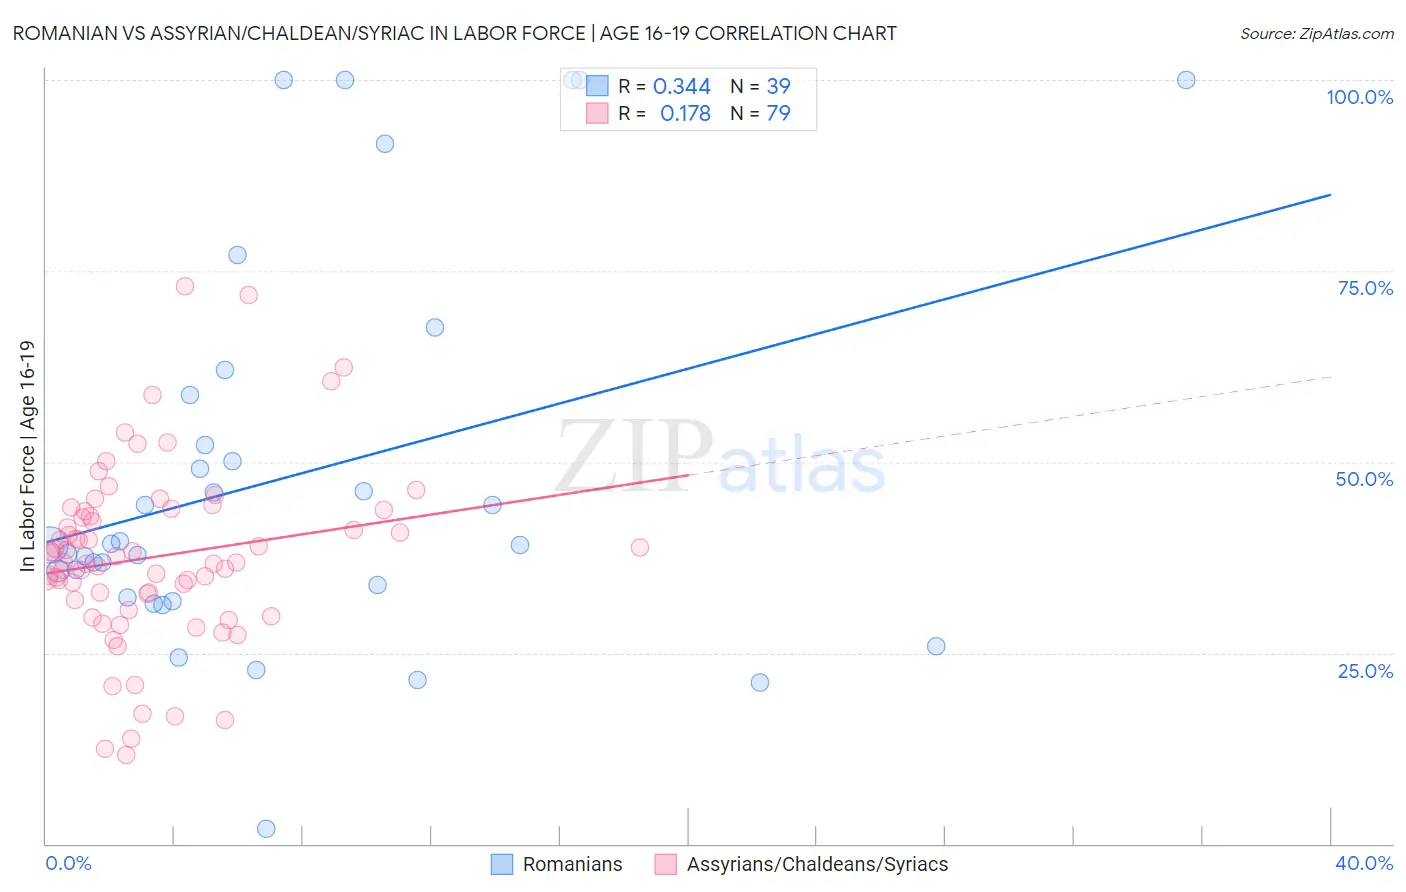
Romanian vs Assyrian/Chaldean/Syriac In Labor Force | Age 16-19 Correlation Chart
The statistical analysis conducted on geographies consisting of 377,266,020 people shows a mild positive correlation between the proportion of Romanians and labor force participation rate among population between the ages 16 and 19 in the United States with a correlation coefficient (R) of 0.344 and weighted average of 37.5%. Similarly, the statistical analysis conducted on geographies consisting of 110,301,649 people shows a poor positive correlation between the proportion of Assyrians/Chaldeans/Syriacs and labor force participation rate among population between the ages 16 and 19 in the United States with a correlation coefficient (R) of 0.178 and weighted average of 38.3%, a difference of 2.3%.
In Labor Force | Age 16-19 Correlation Summary
| Measurement | Romanian | Assyrian/Chaldean/Syriac |
| Minimum | 2.0% | 11.7% |
| Maximum | 100.0% | 73.0% |
| Range | 98.0% | 61.3% |
| Mean | 48.3% | 37.5% |
| Median | 39.2% | 36.8% |
| Interquartile 25% (IQ1) | 32.2% | 31.8% |
| Interquartile 75% (IQ3) | 58.7% | 43.5% |
| Interquartile Range (IQR) | 26.5% | 11.7% |
| Standard Deviation (Sample) | 25.5% | 11.6% |
| Standard Deviation (Population) | 25.2% | 11.6% |
Similar Demographics by In Labor Force | Age 16-19
Demographics Similar to Romanians by In Labor Force | Age 16-19
In terms of in labor force | age 16-19, the demographic groups most similar to Romanians are Brazilian (37.5%, a difference of 0.16%), Immigrants from Western Europe (37.5%, a difference of 0.19%), Japanese (37.5%, a difference of 0.24%), Paiute (37.5%, a difference of 0.24%), and Native Hawaiian (37.4%, a difference of 0.24%).
| Demographics | Rating | Rank | In Labor Force | Age 16-19 |
| Syrians | 90.7 /100 | #141 | Exceptional 37.6% |
| Sierra Leoneans | 89.7 /100 | #142 | Excellent 37.6% |
| Pakistanis | 89.5 /100 | #143 | Excellent 37.6% |
| Japanese | 89.3 /100 | #144 | Excellent 37.5% |
| Paiute | 89.3 /100 | #145 | Excellent 37.5% |
| Immigrants | Western Europe | 88.9 /100 | #146 | Excellent 37.5% |
| Brazilians | 88.7 /100 | #147 | Excellent 37.5% |
| Romanians | 87.3 /100 | #148 | Excellent 37.5% |
| Native Hawaiians | 85.0 /100 | #149 | Excellent 37.4% |
| Tsimshian | 84.7 /100 | #150 | Excellent 37.4% |
| Immigrants | Poland | 84.4 /100 | #151 | Excellent 37.3% |
| Immigrants | Sierra Leone | 83.6 /100 | #152 | Excellent 37.3% |
| Arapaho | 81.8 /100 | #153 | Excellent 37.3% |
| Immigrants | Bulgaria | 81.6 /100 | #154 | Excellent 37.3% |
| Immigrants | Lithuania | 80.7 /100 | #155 | Excellent 37.2% |
Demographics Similar to Assyrians/Chaldeans/Syriacs by In Labor Force | Age 16-19
In terms of in labor force | age 16-19, the demographic groups most similar to Assyrians/Chaldeans/Syriacs are Immigrants from Nepal (38.3%, a difference of 0.020%), Chickasaw (38.3%, a difference of 0.030%), Bulgarian (38.3%, a difference of 0.080%), Colville (38.3%, a difference of 0.080%), and Ukrainian (38.3%, a difference of 0.090%).
| Demographics | Rating | Rank | In Labor Force | Age 16-19 |
| Immigrants | Scotland | 98.5 /100 | #112 | Exceptional 38.5% |
| Sub-Saharan Africans | 98.3 /100 | #113 | Exceptional 38.4% |
| Hawaiians | 98.2 /100 | #114 | Exceptional 38.4% |
| Bulgarians | 97.9 /100 | #115 | Exceptional 38.3% |
| Colville | 97.9 /100 | #116 | Exceptional 38.3% |
| Chickasaw | 97.8 /100 | #117 | Exceptional 38.3% |
| Immigrants | Nepal | 97.8 /100 | #118 | Exceptional 38.3% |
| Assyrians/Chaldeans/Syriacs | 97.8 /100 | #119 | Exceptional 38.3% |
| Ukrainians | 97.6 /100 | #120 | Exceptional 38.3% |
| Ethiopians | 97.4 /100 | #121 | Exceptional 38.2% |
| Guamanians/Chamorros | 97.4 /100 | #122 | Exceptional 38.2% |
| Seminole | 96.7 /100 | #123 | Exceptional 38.1% |
| Immigrants | England | 96.4 /100 | #124 | Exceptional 38.1% |
| Immigrants | Africa | 96.1 /100 | #125 | Exceptional 38.0% |
| Africans | 95.6 /100 | #126 | Exceptional 38.0% |