West Indian vs European In Labor Force | Age > 16
COMPARE
West Indian
European
In Labor Force | Age > 16
In Labor Force | Age > 16 Comparison
West Indians
Europeans
64.5%
IN LABOR FORCE | AGE > 16
3.0/ 100
METRIC RATING
245th/ 347
METRIC RANK
64.7%
IN LABOR FORCE | AGE > 16
8.3/ 100
METRIC RATING
226th/ 347
METRIC RANK
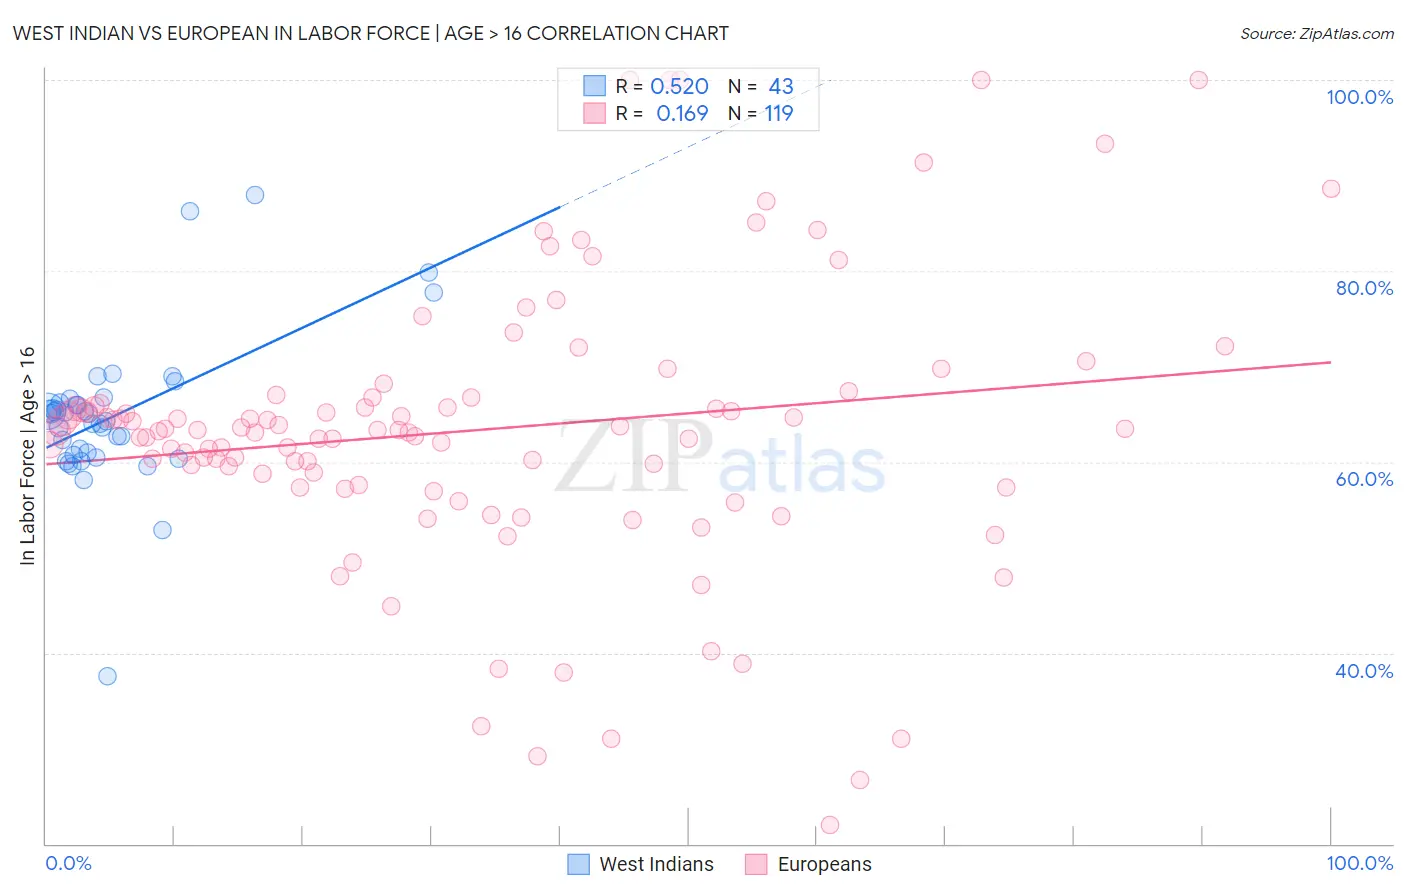
West Indian vs European In Labor Force | Age > 16 Correlation Chart
The statistical analysis conducted on geographies consisting of 254,052,877 people shows a substantial positive correlation between the proportion of West Indians and labor force participation rate among population ages 16 and over in the United States with a correlation coefficient (R) of 0.520 and weighted average of 64.5%. Similarly, the statistical analysis conducted on geographies consisting of 561,841,605 people shows a poor positive correlation between the proportion of Europeans and labor force participation rate among population ages 16 and over in the United States with a correlation coefficient (R) of 0.169 and weighted average of 64.7%, a difference of 0.30%.
In Labor Force | Age > 16 Correlation Summary
| Measurement | West Indian | European |
| Minimum | 37.5% | 22.0% |
| Maximum | 87.9% | 100.0% |
| Range | 50.4% | 78.0% |
| Mean | 64.8% | 63.4% |
| Median | 65.1% | 63.3% |
| Interquartile 25% (IQ1) | 60.7% | 57.6% |
| Interquartile 75% (IQ3) | 66.2% | 66.7% |
| Interquartile Range (IQR) | 5.5% | 9.1% |
| Standard Deviation (Sample) | 7.9% | 14.7% |
| Standard Deviation (Population) | 7.8% | 14.7% |
Demographics Similar to West Indians and Europeans by In Labor Force | Age > 16
In terms of in labor force | age > 16, the demographic groups most similar to West Indians are Tsimshian (64.5%, a difference of 0.0%), Immigrants from Lebanon (64.5%, a difference of 0.020%), Immigrants from Netherlands (64.5%, a difference of 0.030%), Immigrants from Dominica (64.5%, a difference of 0.040%), and Immigrants from Bangladesh (64.5%, a difference of 0.050%). Similarly, the demographic groups most similar to Europeans are Polish (64.7%, a difference of 0.0%), Northern European (64.7%, a difference of 0.0%), Croatian (64.7%, a difference of 0.020%), British (64.7%, a difference of 0.040%), and Chinese (64.7%, a difference of 0.040%).
| Demographics | Rating | Rank | In Labor Force | Age > 16 |
| Croatians | 8.8 /100 | #225 | Tragic 64.7% |
| Europeans | 8.3 /100 | #226 | Tragic 64.7% |
| Poles | 8.3 /100 | #227 | Tragic 64.7% |
| Northern Europeans | 8.2 /100 | #228 | Tragic 64.7% |
| British | 7.3 /100 | #229 | Tragic 64.7% |
| Chinese | 7.3 /100 | #230 | Tragic 64.7% |
| Immigrants | Northern Europe | 7.2 /100 | #231 | Tragic 64.7% |
| Africans | 5.8 /100 | #232 | Tragic 64.6% |
| Slavs | 4.9 /100 | #233 | Tragic 64.6% |
| Vietnamese | 4.7 /100 | #234 | Tragic 64.6% |
| Austrians | 4.6 /100 | #235 | Tragic 64.6% |
| Immigrants | Norway | 4.6 /100 | #236 | Tragic 64.6% |
| Italians | 4.6 /100 | #237 | Tragic 64.6% |
| Lebanese | 3.9 /100 | #238 | Tragic 64.5% |
| Immigrants | Hungary | 3.8 /100 | #239 | Tragic 64.5% |
| Immigrants | Bangladesh | 3.6 /100 | #240 | Tragic 64.5% |
| Immigrants | Dominica | 3.5 /100 | #241 | Tragic 64.5% |
| Immigrants | Netherlands | 3.4 /100 | #242 | Tragic 64.5% |
| Immigrants | Lebanon | 3.2 /100 | #243 | Tragic 64.5% |
| Tsimshian | 3.1 /100 | #244 | Tragic 64.5% |
| West Indians | 3.0 /100 | #245 | Tragic 64.5% |